Hive Financial Statistics – 2022.07.26

Welcome to the daily financial report about the Hive blockchain.
All the information presented in this report is based on the data collected from the blockchain until 2022-07-26 midnight UTC. This report aims to provide you with a clear view of what is happening on the Hive blockchain.
 Este post está traducido al español - aquí
 Dieser Beitrag ist ins Deutsche übersetzt - hier
 Une version en français de ce post est disponible - ici
1. Price
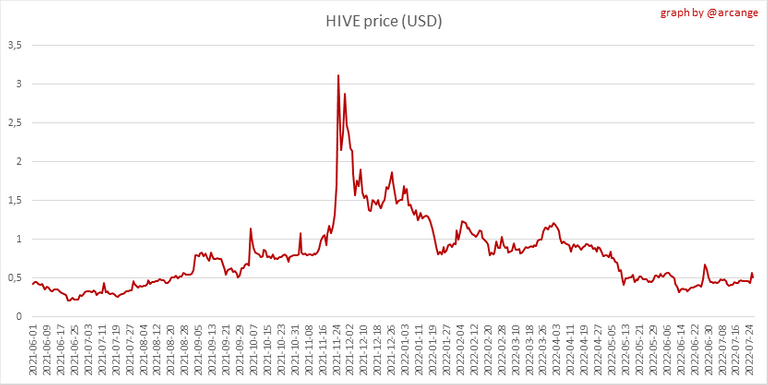 | 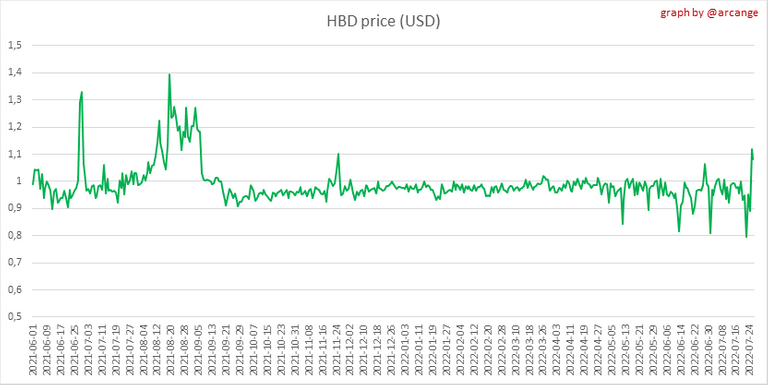 |
These graphs show the evolution of prices in USD for HIVE and HBD.
2. Supply
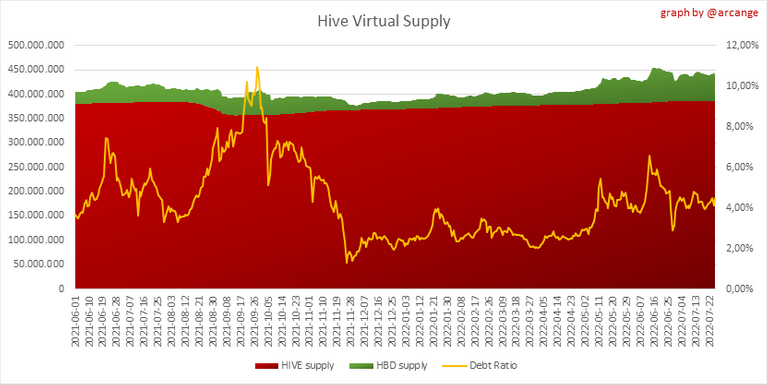
This graph shows the evolution of HIVE virtual Supply. The virtual supply is the sum of HIVE supply (liquid and staked HIVE) and HBD supply (converted into HIVE).
The graph also displays the debt ratio (HBD supply / HIVE virtual supply). Keep in mind that since hardfork 24 funds in the treasury (@hive.fund HBD balance) don't count towards the HBD debt ratio.
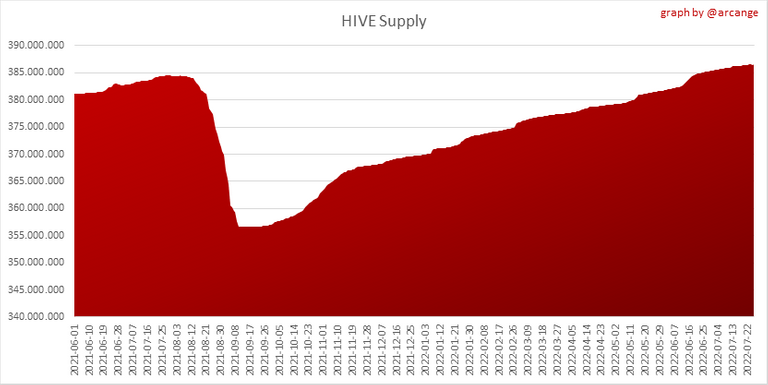 | 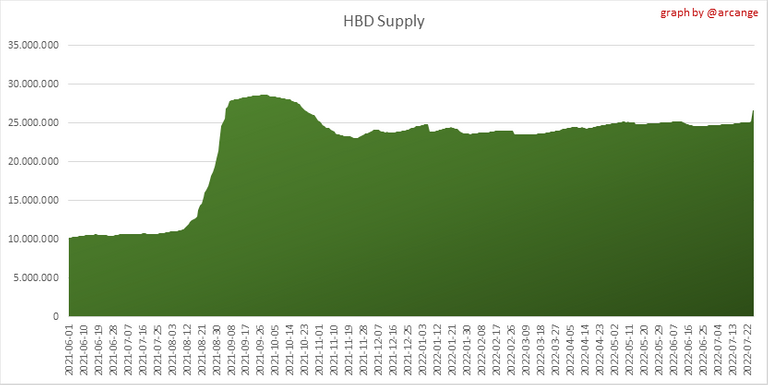 |
These graphs show the evolution of the HIVE Supply (both liquid and staked) and the HBD supply.
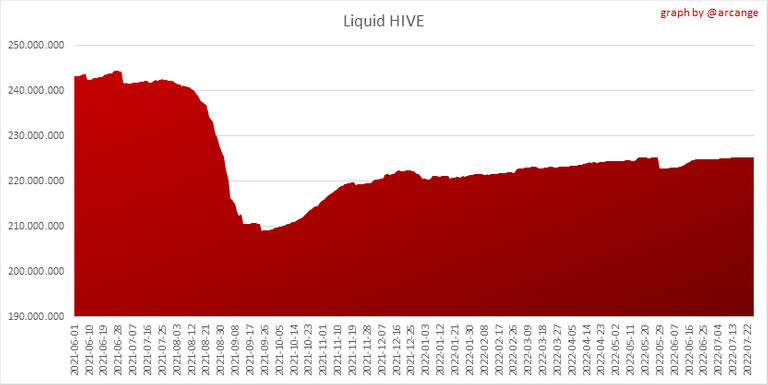 | 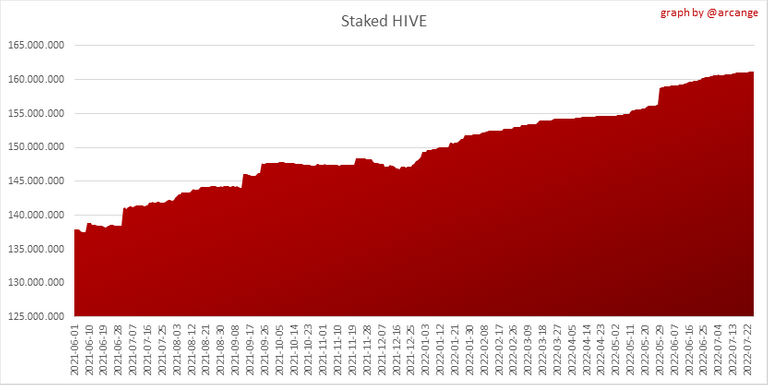 |
These charts show the evolution of the liquid HIVE and the staked HIVE (Hive Power).
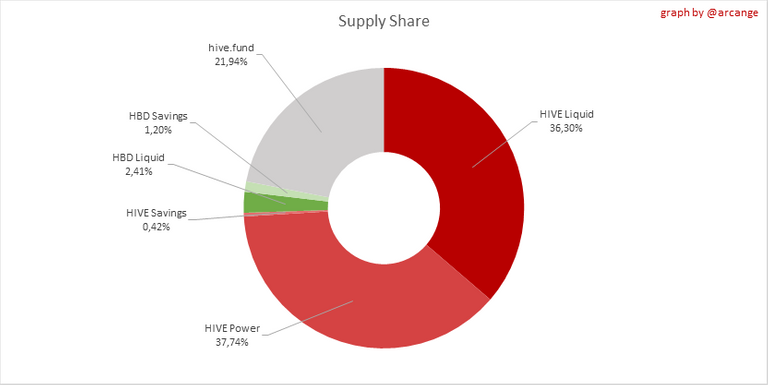
This graph shows the overall Hive tokens distribution.
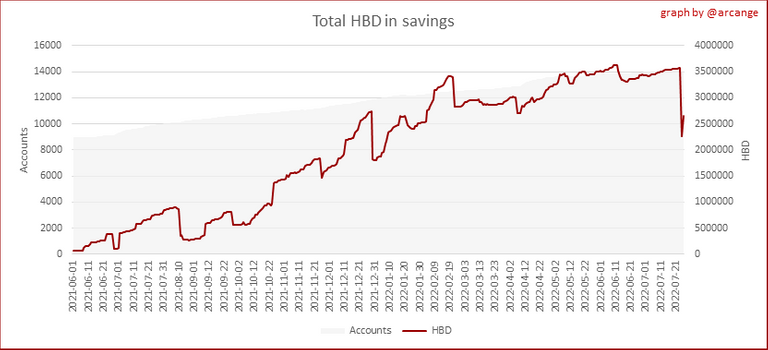
3. HBD Savings
| Account | Deposit | Account | Withdrawal |
|---|---|---|---|
| @yunnie | 5,604.140 HBD | @vimm | 451.484 HBD |
| @bnb-hbd | 1,250.000 HBD | @poshtoken | 295.599 HBD |
| @investegg | 474.398 HBD | @funnel | 236.000 HBD |
| @taruk | 406.000 HBD | @johnhtims.life | 135.800 HBD |
| @artsyproxy | 397.775 HBD | @happycrazycon | 130.000 HBD |
| @worldfinances | 248.147 HBD | @ecoinstats | 100.000 HBD |
| @charsdesign | 200.000 HBD | @stevenson7 | 100.000 HBD |
| @nicole2016 | 129.662 HBD | @neoxian.alfa | 100.000 HBD |
| @guiltyparties | 123.869 HBD | @bacon-dub | 72.465 HBD |
| @bernardino | 100.000 HBD | @sk1920 | 43.142 HBD |
This graph shows how much and how many accounts store HBD in savings. The table below shows the topmost HBD deposits and withdrawals of the day.
Note: As of 2021-06-30 (HF25) interest is only paid for HBD which are stored in savings.
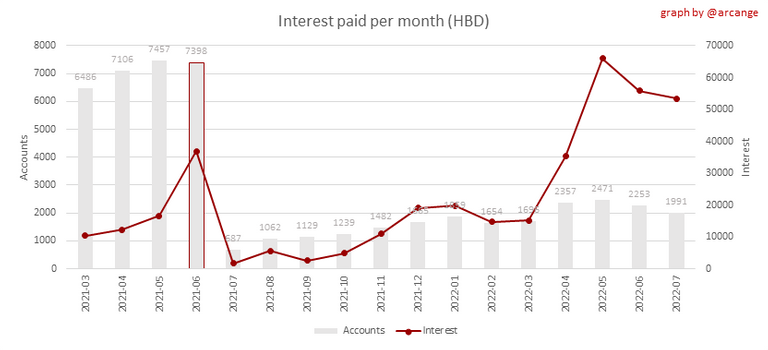
This chart shows the amount of interest paid each month for holding HBD and how many accounts received such interest.
4. Balances
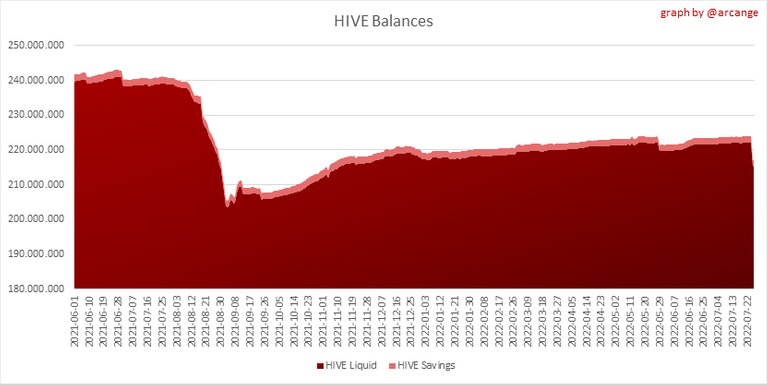
This graph shows the number of HIVE, both liquid and in savings, held by all accounts.
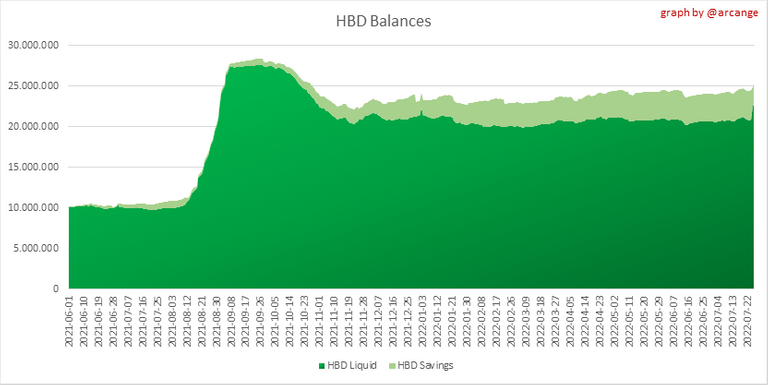
This graph shows the number of HBD, both liquid and in savings, held by all accounts.
5. Conversions
Note: As a reminder, conversion requests are only finalized after 3 days. It is only then that it is known exactly how many HIVE were burned in return for the HBD received at the time of the conversion request.
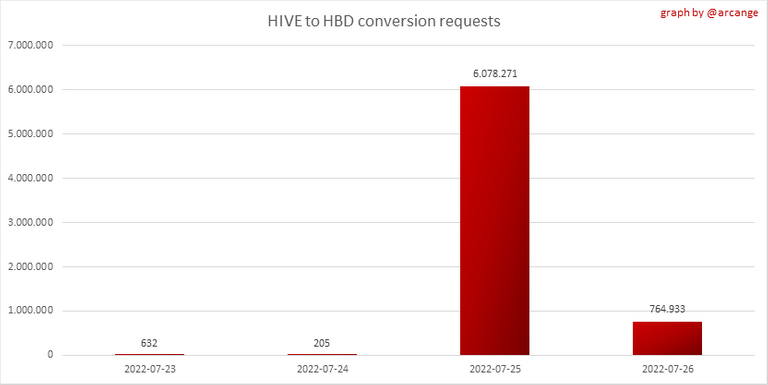
This graph shows the number of HIVE collateralized due to requests to convert HIVE to HBD over the past few days.
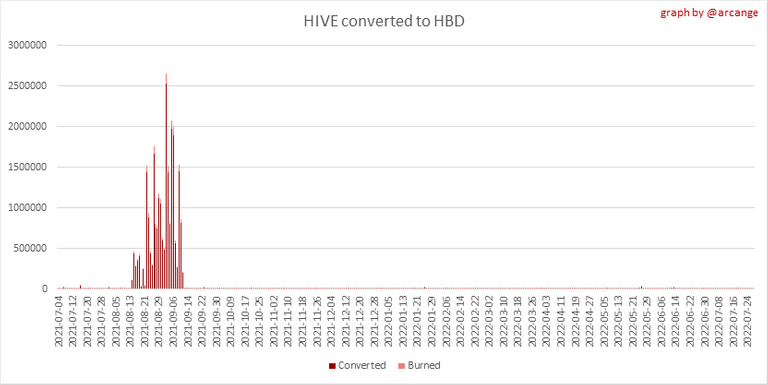 | 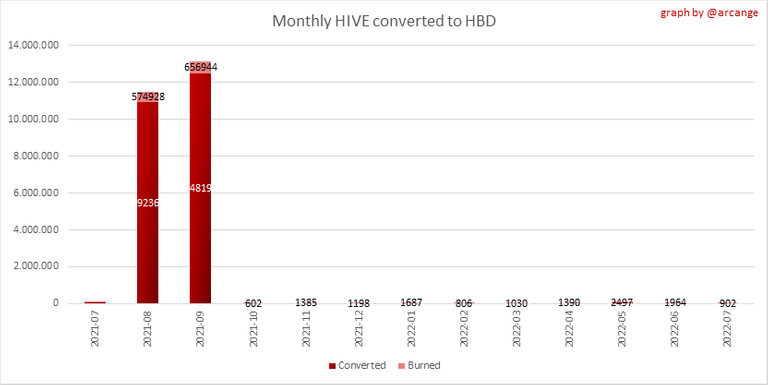 |
These graphs show the number of HIVE effectively used by the conversion process (HIVE converted and 5% HIVE fee which is burned) each day and month when requests to convert HIVE to HBD have been finalized.
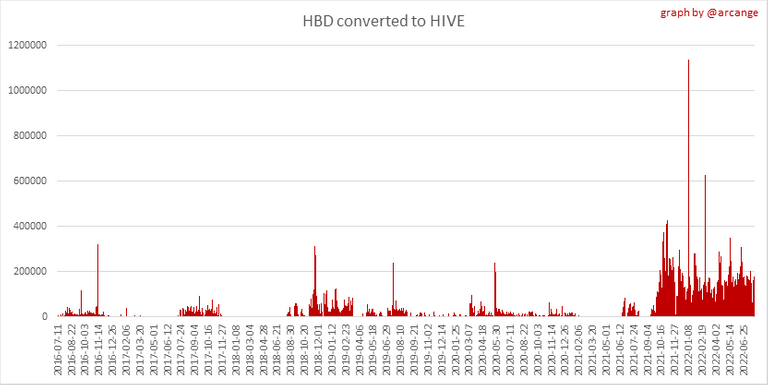 | 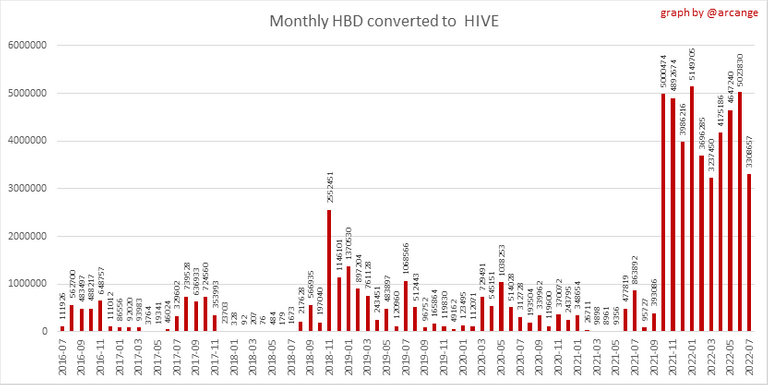 |
These graphs show the number of HBD burned, each day and each month, following requests to convert HBD to HIVE.
6. Powerup and Powerdown
| Date | Account | Amount |
|---|---|---|
| 2022-07-26 08:29:36 | @ohanahealing | 29,625.884 HIVE |
| 2022-07-26 12:31:45 | @satren | 26,575.773 HIVE |
| 2022-07-26 08:51:51 | @cryptictruth | 15,896.045 HIVE |
| 2022-07-26 02:35:57 | @dcrops | 6,463.400 HIVE |
| 2022-07-26 05:34:15 | @ahmetay | 3,380.312 HIVE |
| 2022-07-26 01:36:54 | @rima11 | 3,090.088 HIVE |
| 2022-07-26 04:05:39 | @kaelci | 2,808.273 HIVE |
| 2022-07-26 12:12:09 | @bertrayo | 1,827.436 HIVE |
| 2022-07-26 11:21:12 | @josevillanueva | 1,712.056 HIVE |
| 2022-07-26 05:33:33 | @kaminchan | 1,600.477 HIVE |
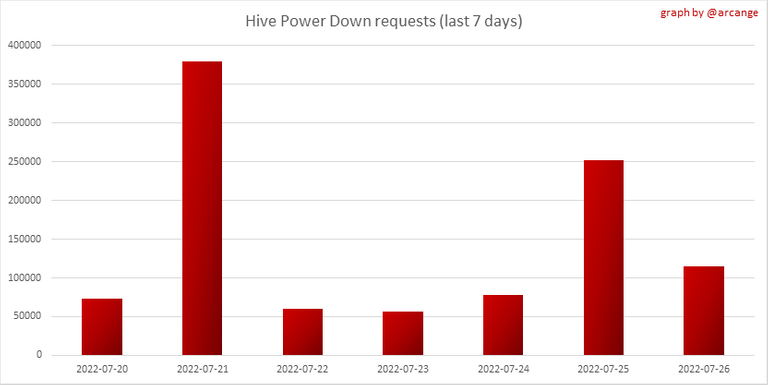
This graph and table show the amount of powerdown initiated over the last 7 days, and the largest initiated on this day.
| Account | Powerup | Account | Powerdown |
|---|---|---|---|
| @anewclassic | 10,710.014 HIVE | @brettpullen | 8,095.028 HIVE |
| @dcrops | 9,160.700 HIVE | @p-hive | 6,167.642 HIVE |
| @slobberchops | 5,034.309 HIVE | @curangel | 5,005.617 HIVE |
| @bnb-hive | 2,500.000 HIVE | @roelandp | 4,015.832 HIVE |
| @ninjascott | 2,091.808 HIVE | @leo.voter | 3,743.936 HIVE |
| @camuel | 2,000.000 HIVE | @asgarth | 3,072.216 HIVE |
| @catwomanteresa | 1,000.000 HIVE | @schlees | 2,515.587 HIVE |
| @ahmetay | 623.260 HIVE | @armentor | 2,491.151 HIVE |
| @cliffagreen | 518.146 HIVE | @synrg | 2,462.270 HIVE |
| @jedielf | 347.375 HIVE | @michelios | 2,387.294 HIVE |
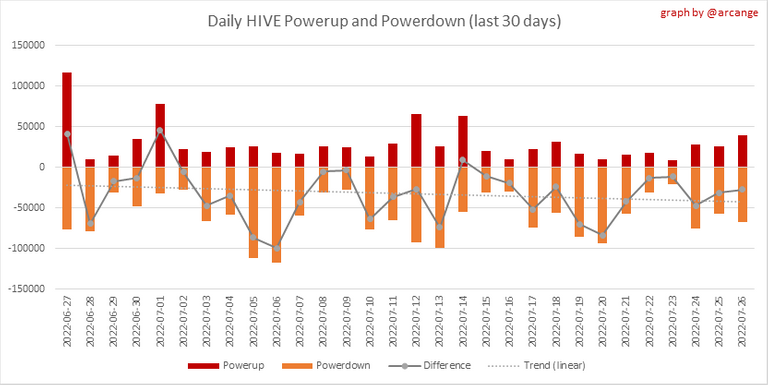
This graph shows the daily HIVE power-up, power-down, and the resulting variation over the last 30 days. The table shows the topmost power-ups and power-downs of the day.
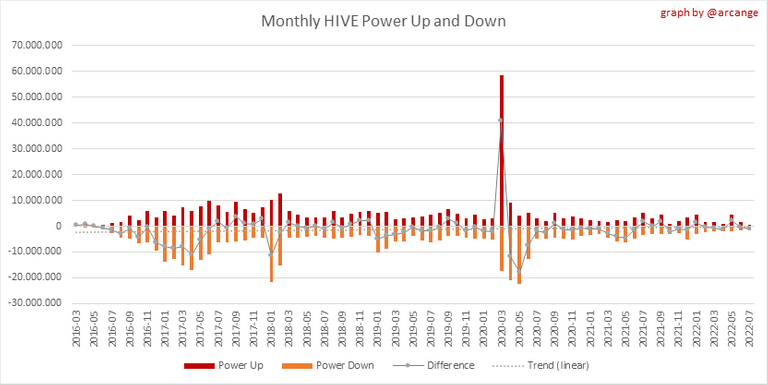
This graph shows the monthly HIVE power-up, power-down and the resulting variation.
Values for the last 3 months
| Period | Powerup | Powerdown | Difference |
|---|---|---|---|
| 2022-07 | 699,093.000 | 1,602,220.000 | -903,127.000 |
| 2022-06 | 1,444,478.000 | 1,698,001.000 | -253,523.000 |
| 2022-05 | 4,321,244.000 | 2,069,335.000 | 2,251,909.000 |
7. Transfers
These graphs show the volume (in USD) of HIVE and HBD transferred between accounts.
8. Exchanges
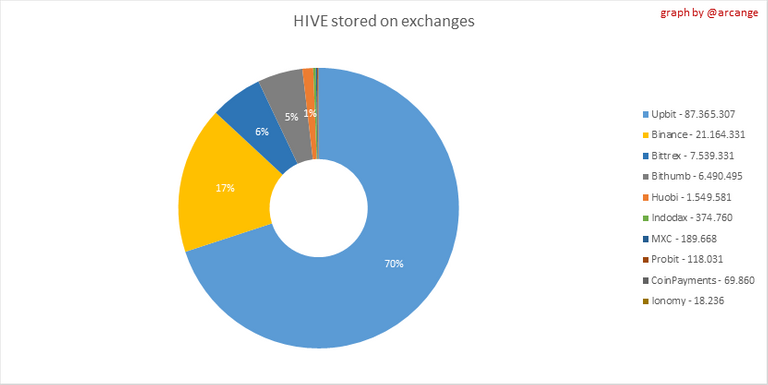 | 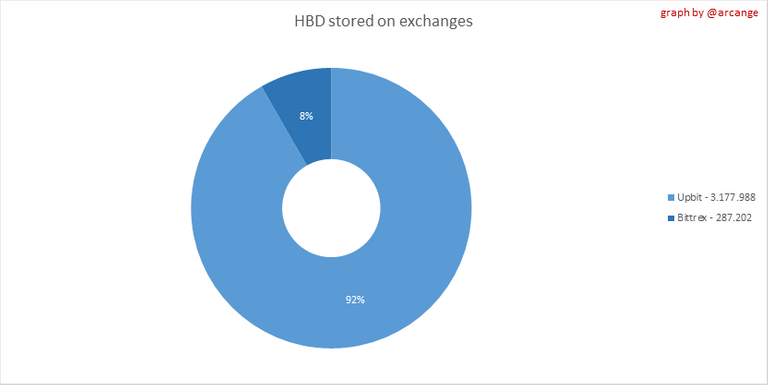 |
These graphs show the amount and distribution of HIVE and HBD stored on the exchanges where they are listed.
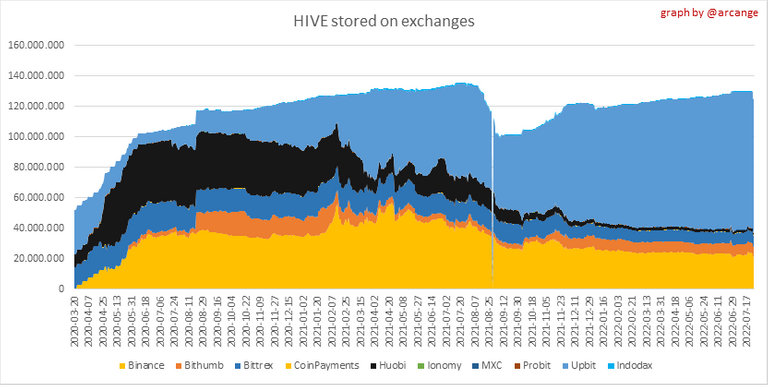 | 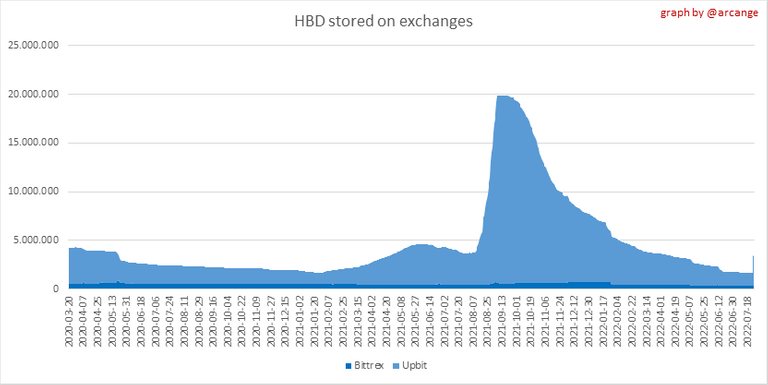 |
These graphs show the daily evolution of HIVE and HBD stored on the exchanges where they are listed.
I hope you find those stats useful. If you would like to see additional stats, feel free to drop me a comment. Your feedback is than welcome.
Thanks for reading.
Check out my apps and services


Most times I just go through Hive doing my thing. Seeing a post like this reminds me of just how much crypto is really getting moved around and invested here :) ... Makes me want to keep on striving towards being a whale!
Whale, whale, whale, what do we have here?? 😉
In my case, a minnow with big dreams - or dreems :)
!PIZZA !ALIVE !LOL
@synrg! You Are Alive so I just staked 0.1 $ALIVE to your account on behalf of @wrestlingdesires. (7/10)
The tip has been paid for by the We Are Alive Tribe through the earnings on @alive.chat, feel free to swing by our daily chat any time you want.

Looking forward to you becoming a whale @wrestlingdesires
Thanks 🙌 I have faith that it will happen, little by little :) ...
!PIZZA !ALIVE !LOL
@arcange! You Are Alive so I just staked 0.1 $ALIVE to your account on behalf of @wrestlingdesires. (10/10)
The tip has been paid for by the We Are Alive Tribe through the earnings on @alive.chat, feel free to swing by our daily chat any time you want.

lolztoken.com
A ques-idea.
Credit: reddit
@arcange, I sent you an $LOLZ on behalf of @wrestlingdesires
Are You Ready for some $FUN? Learn about LOLZ's new FUN tribe!
(3/4)
For anyone that’s worried my powerdown was to show somebody how it works. It was canceled shortly after I submitted it. Y’all can’t get rid of me that easy.
Glad to read you are here for the long term @cryptictruth ❤️
Thanks for collecting that data. Are you running sql query to pull this data?
Yes, I eat my own dog food (HiveSQL)
BTW, your support to the HiveSQL proposal would be welcome. 😉
$WINE
Congratulations, @theguruasia You Successfully Shared 0.200 WINEX With @arcange.
You Earned 0.200 WINEX As Curation Reward.
You Utilized 2/3 Successful Calls.
Contact Us : WINEX Token Discord Channel
WINEX Current Market Price : 0.168
Swap Your Hive <=> Swap.Hive With Industry Lowest Fee (0.1%) : Click This Link
Read Latest Updates Or Contact Us
PIZZA Holders sent $PIZZA tips in this post's comments:
wrestlingdesires tipped synrg (x1)
@wrestlingdesires(13/15) tipped @arcange (x1)
Join us in Discord!