Hive Financial Statistics – 2023.09.04

Welcome to the daily financial report about the Hive blockchain.
All the information presented in this report is based on the data collected from the blockchain until 2023-09-04 midnight UTC. This report aims to provide you with a clear view of what is happening on the Hive blockchain.
 Este post está traducido al español - aquí
 Dieser Beitrag ist ins Deutsche übersetzt - hier
 Une version en français de ce post est disponible - ici
1. Price
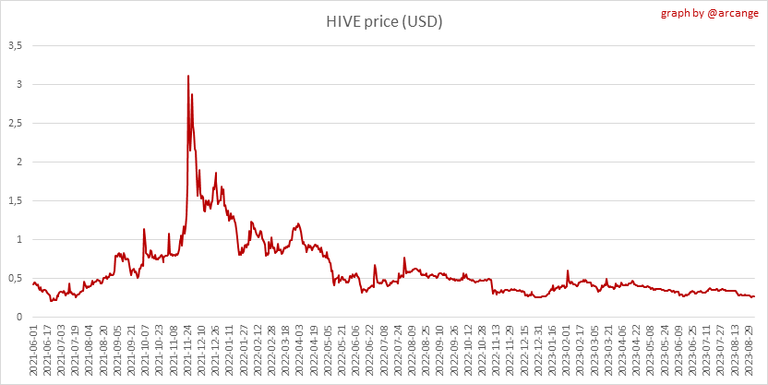 | 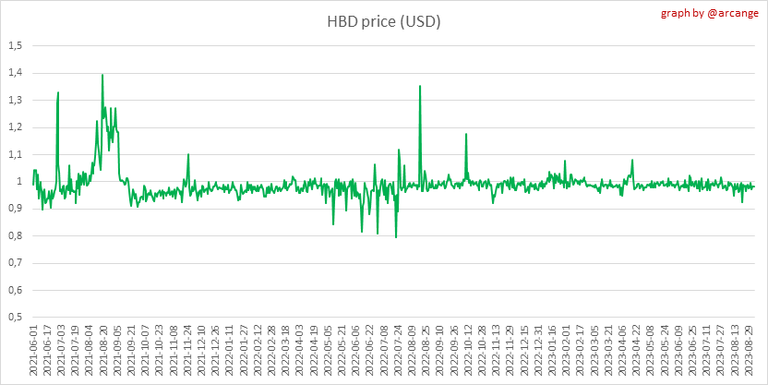 |
These graphs show the evolution of prices in USD for HIVE and HBD.
2. Supply
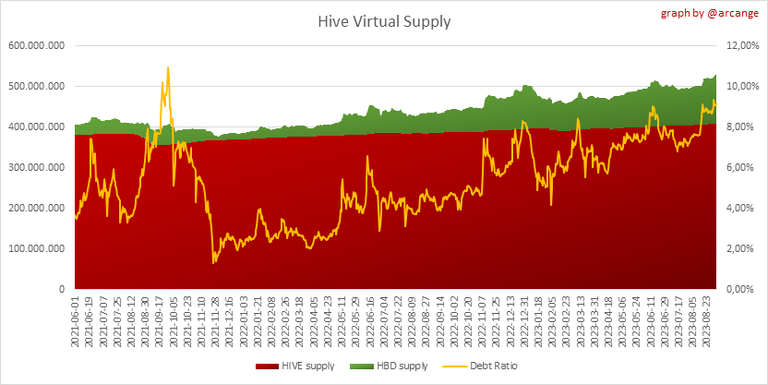
This graph shows the evolution of HIVE virtual Supply. The virtual supply is the sum of HIVE supply (liquid and staked HIVE) and HBD supply (converted into HIVE).
The graph also displays the debt ratio (HBD supply / HIVE virtual supply). Keep in mind that since hardfork 24 funds in the treasury (@hive.fund HBD balance) don't count towards the HBD debt ratio.
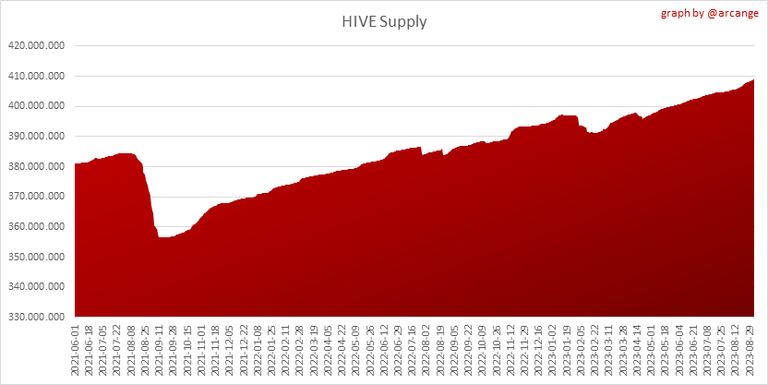 | 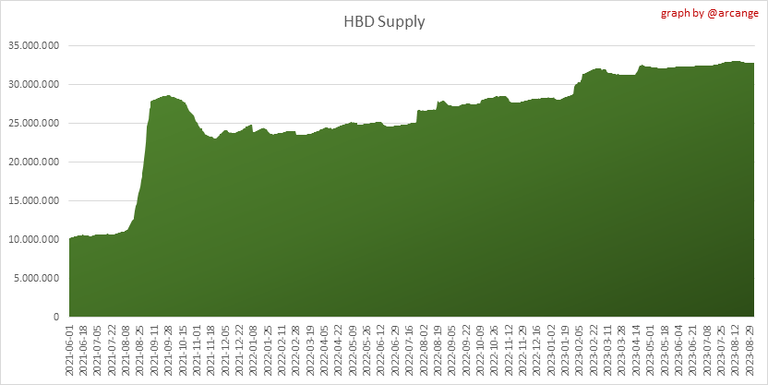 |
These graphs show the evolution of the HIVE Supply (both liquid and staked) and the HBD supply.
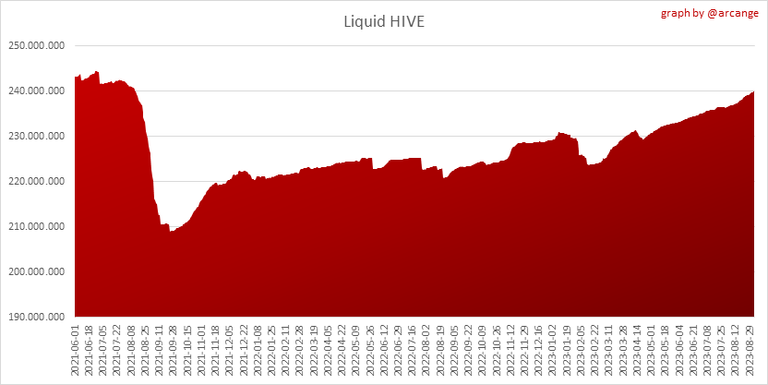 | 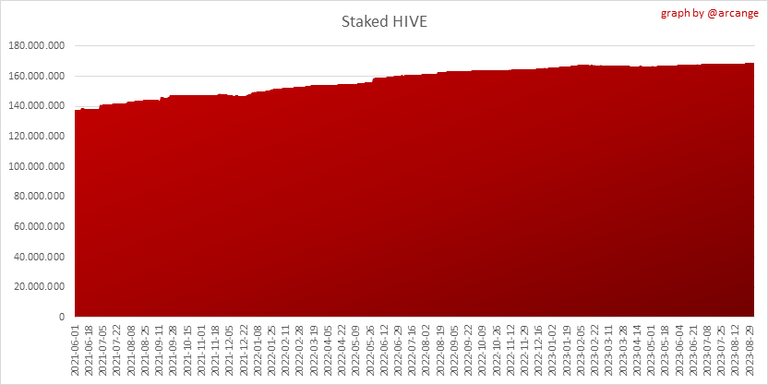 |
These charts show the evolution of the liquid HIVE and the staked HIVE (Hive Power).
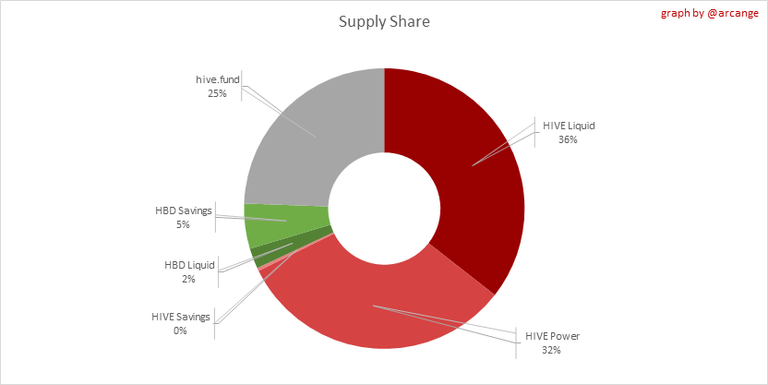
This graph shows the overall Hive tokens distribution.
3. HBD Savings
| Account | Deposit | Account | Withdrawal |
|---|---|---|---|
| @steemychicken1 | 1,000.000 HBD | @pharesim | 20,281.611 HBD |
| @clipoftheday | 196.757 HBD | @muenchen | 20,000.000 HBD |
| @hiveauth | 121.869 HBD | @bnb-hbd | 10,000.000 HBD |
| @traciyork | 63.333 HBD | @khal.leo | 3,000.000 HBD |
| @beeber | 58.826 HBD | @lazy-ninja | 2,500.000 HBD |
| @dkid14 | 45.909 HBD | @curangel | 1,787.442 HBD |
| @sjarvie5 | 44.000 HBD | @meesterboom | 1,000.000 HBD |
| @wulff-media | 38.097 HBD | @friendlymoose | 677.817 HBD |
| @caro-art | 36.715 HBD | @hive.one | 250.000 HBD |
| @shufunk | 33.652 HBD | @ohy | 227.018 HBD |
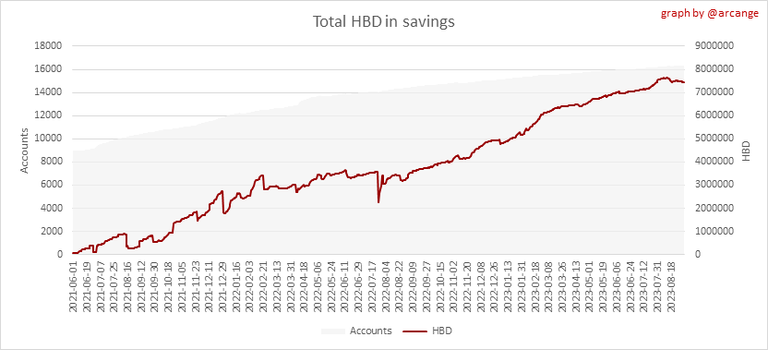
This graph shows how much and how many accounts store HBD in savings. The table below shows the topmost HBD deposits and withdrawals of the day.
Note: As of 2021-06-30 (HF25) interest is only paid for HBD which are stored in savings.
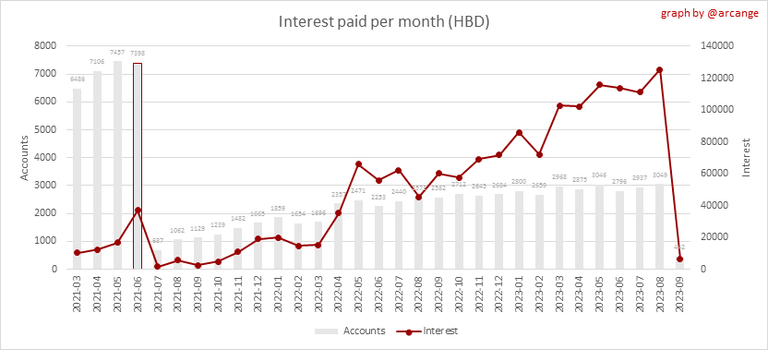
This chart shows the amount of interest paid each month for holding HBD and how many accounts received such interest.
4. Balances
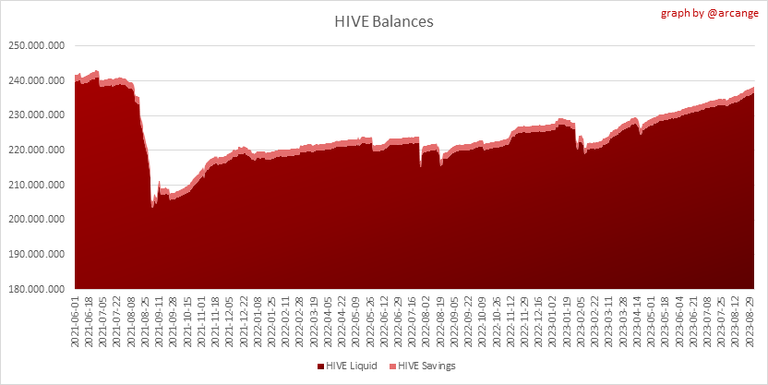
This graph shows the number of HIVE, both liquid and in savings, held by all accounts.
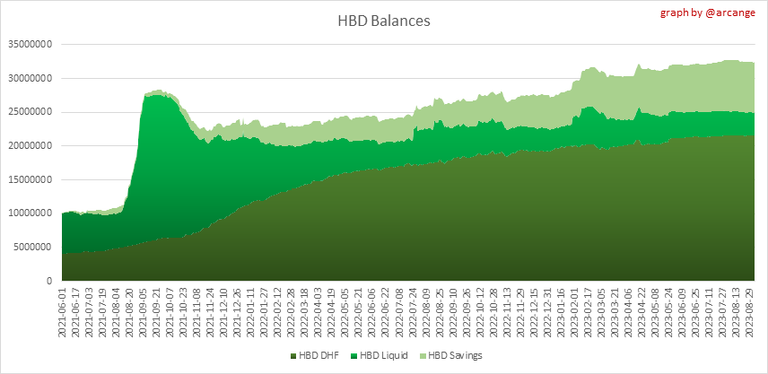
This graph shows the number of HBD, both liquid and in savings, held by all accounts. It also displays the amount of HBD stored in the Decentralized Hive Fund (DHF).
5. Conversions
Note: As a reminder, conversion requests are only finalized after 3 days. It is only then that it is known exactly how many HIVE were burned in return for the HBD received at the time of the conversion request.
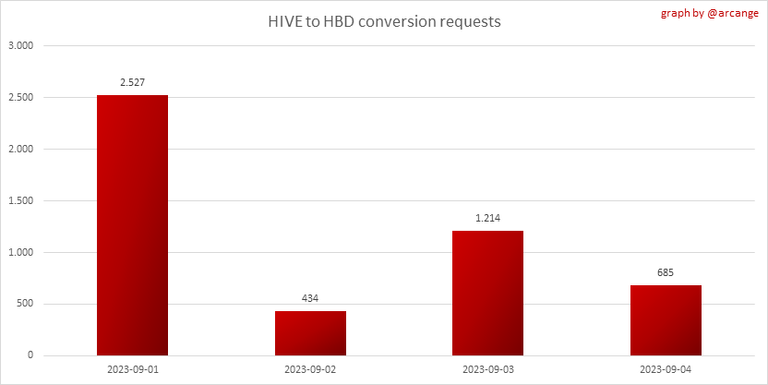
This graph shows the number of HIVE collateralized due to requests to convert HIVE to HBD over the past few days.
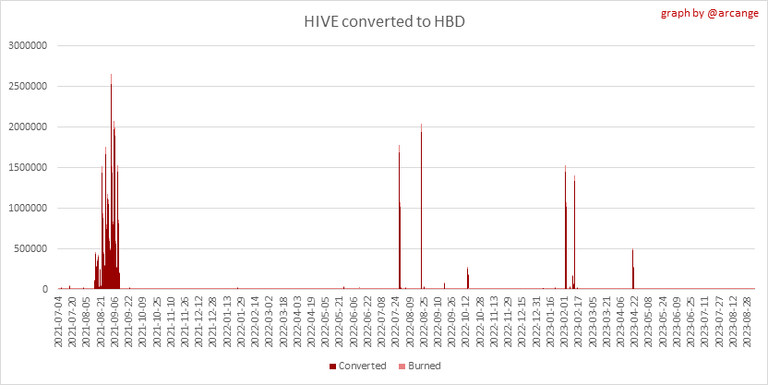 | 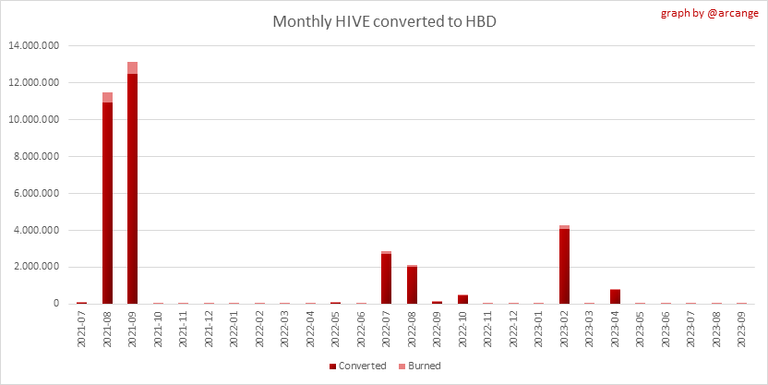 |
These graphs show the number of HIVE effectively used by the conversion process (HIVE converted and 5% HIVE fee which is burned) each day and month when requests to convert HIVE to HBD have been finalized.
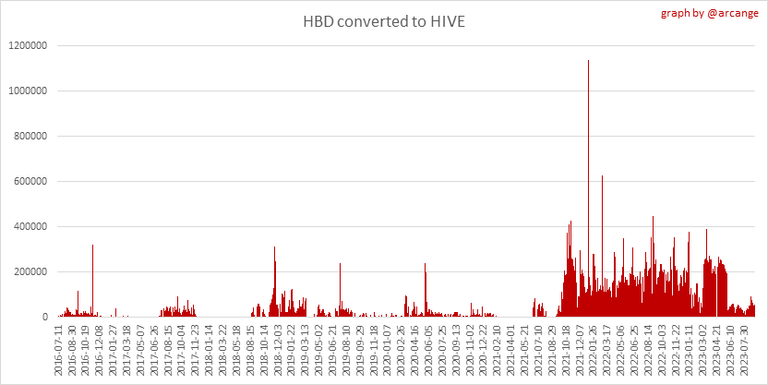 | 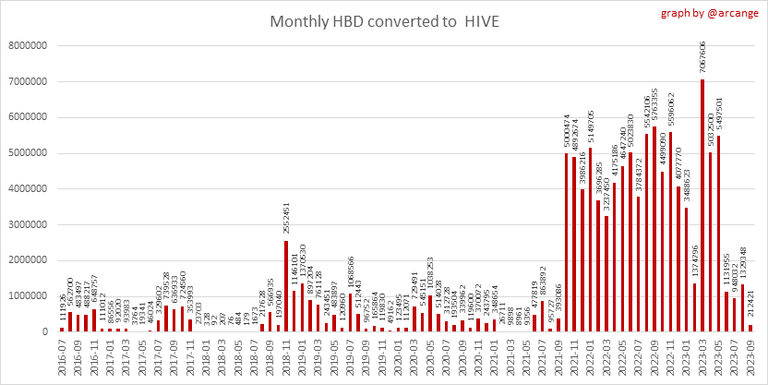 |
These graphs show the number of HBD burned, each day and each month, following requests to convert HBD to HIVE.
6. Powerup and Powerdown
| Date | Account | Amount |
|---|---|---|
| 2023-09-04 04:39:09 | @good-karma | 35,162.397 HIVE |
| 2023-09-04 07:19:54 | @vancouverpics | 9,300.642 HIVE |
| 2023-09-04 05:52:12 | @bertrayo | 5,072.166 HIVE |
| 2023-09-04 04:22:33 | @dylanhobalart | 3,531.450 HIVE |
| 2023-09-04 05:54:30 | @bertrayo | 2,600.085 HIVE |
| 2023-09-04 03:51:36 | @iamsaray | 1,493.853 HIVE |
| 2023-09-04 11:16:12 | @ostap.tkachuk | 1,158.016 HIVE |
| 2023-09-04 07:47:48 | @marnaza | 1,119.540 HIVE |
| 2023-09-04 11:27:30 | @ihavethedream | 1,021.301 HIVE |
| 2023-09-04 04:53:51 | @vikthor | 957.683 HIVE |
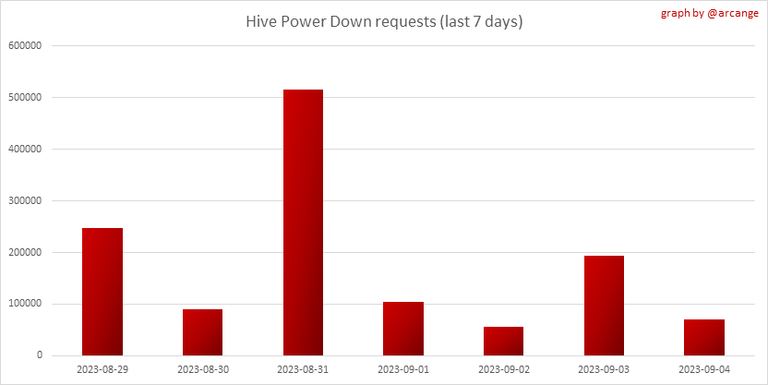
This graph and table show the amount of powerdown initiated over the last 7 days, and the largest initiated on this day.
| Account | Powerup | Account | Powerdown |
|---|---|---|---|
| @sydechan | 18,805.131 HIVE | @steempty | 14,355.802 HIVE |
| @nordics | 2,969.343 HIVE | @nuthman | 9,357.237 HIVE |
| @skiptvads | 2,840.027 HIVE | @steempeak | 3,105.416 HIVE |
| @numisart | 2,540.016 HIVE | @jaynie | 2,747.160 HIVE |
| @armpcm | 2,500.970 HIVE | @good-karma | 2,712.587 HIVE |
| @acidyo | 1,048.998 HIVE | @armandosodano | 1,344.775 HIVE |
| @catwomanteresa | 1,000.000 HIVE | @poshtoken | 1,342.466 HIVE |
| @thehive | 697.279 HIVE | @curie | 1,303.770 HIVE |
| @queengaga | 682.929 HIVE | @sydechan | 1,243.973 HIVE |
| @pacoandujar | 547.428 HIVE | @ua-promoter | 1,066.717 HIVE |
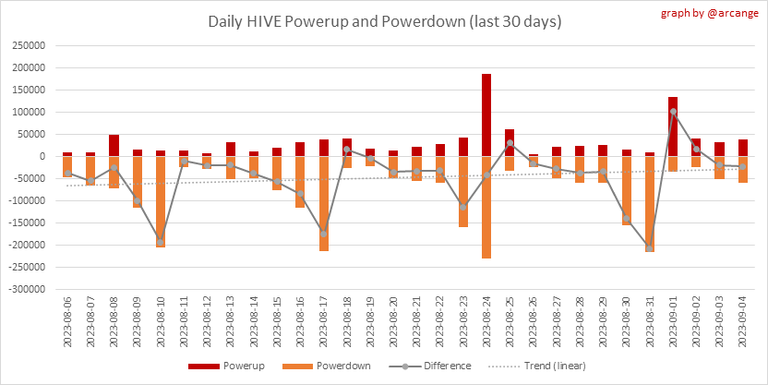
This graph shows the daily HIVE power-up, power-down, and the resulting variation over the last 30 days. The table shows the topmost power-ups and power-downs of the day.
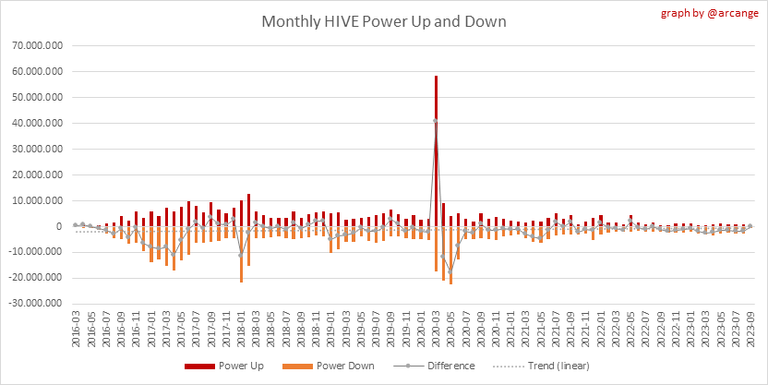
This graph shows the monthly HIVE power-up, power-down and the resulting variation.
Values for the last 3 months
| Period | Powerup | Powerdown | Difference |
|---|---|---|---|
| 2023-09 | 247,154.000 | 167,142.000 | 80,012.000 |
| 2023-08 | 907,139.000 | 2,787,146.000 | -1,880,007.000 |
| 2023-07 | 966,358.000 | 2,617,375.000 | -1,651,017.000 |
7. Transfers
These graphs show the volume (in USD) of HIVE and HBD transferred between accounts.
8. Exchanges
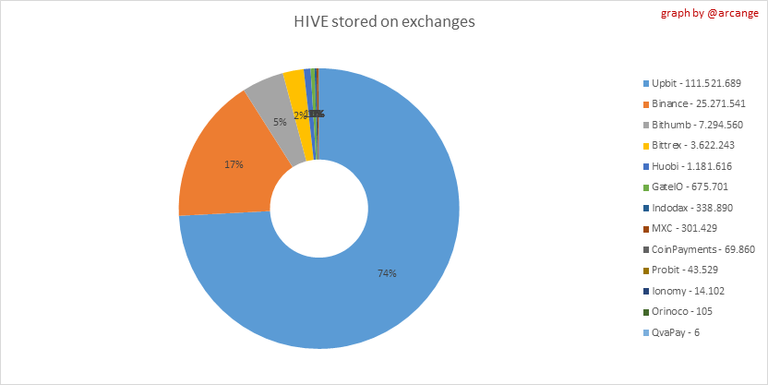 | 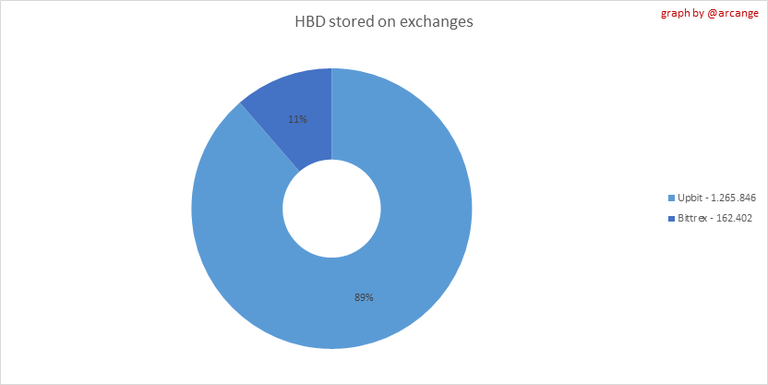 |
These graphs show the amount and distribution of HIVE and HBD stored on the exchanges where they are listed.
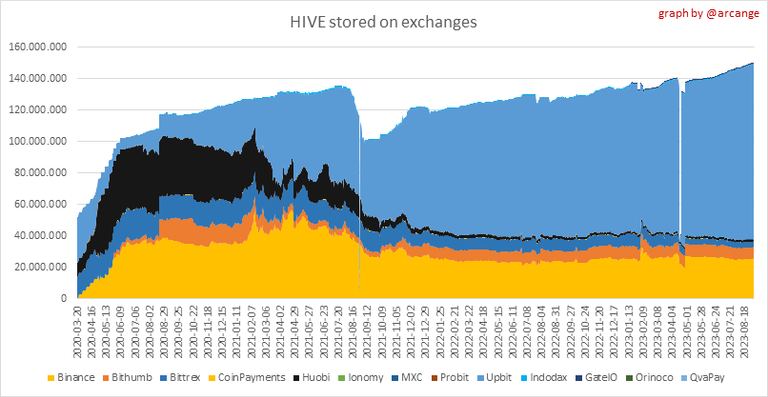 | 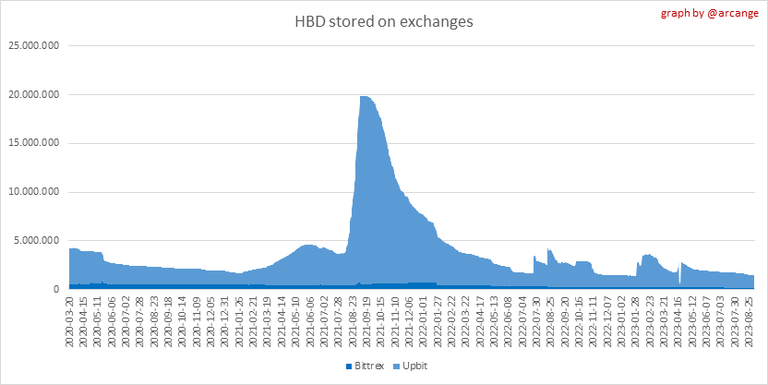 |
These graphs show the daily evolution of HIVE and HBD stored on the exchanges where they are listed.
I hope you find those stats useful. If you would like to see additional stats, feel free to drop me a comment. Your feedback is than welcome.
Thanks for reading.
Check out my apps and services


Good job @arcange
Keep the good work on!
Thank you @ibbtammy
You are welcome!!
!PGM
!ALIVE
!PIZZA
!LUV
!BEER
!LOLZ
@arcange! You Are Alive so I just staked 0.1 $ALIVE to your account on behalf of @ chillmaw. (10/10)
The tip has been paid for by the We Are Alive Tribe through the earnings on @alive.chat, feel free to swing by our daily chat any time you want, plus you can win Hive Power (2x 50 HP) and Alive Power (2x 500 AP) delegations (4 weeks), and Ecency Points (4x 50 EP), in our chat every day.
