Hive Financial Statistics – 2023.03.12

Welcome to the daily financial report about the Hive blockchain.
All the information presented in this report is based on the data collected from the blockchain until 2023-03-12 midnight UTC. This report aims to provide you with a clear view of what is happening on the Hive blockchain.
 Este post está traducido al español - aquí
 Dieser Beitrag ist ins Deutsche übersetzt - hier
 Une version en français de ce post est disponible - ici
1. Price
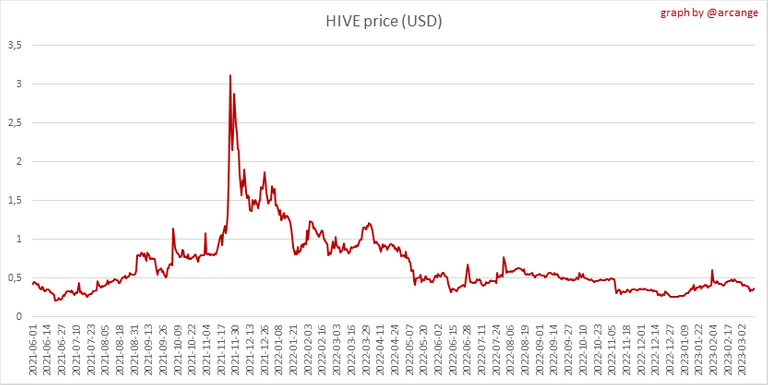 | 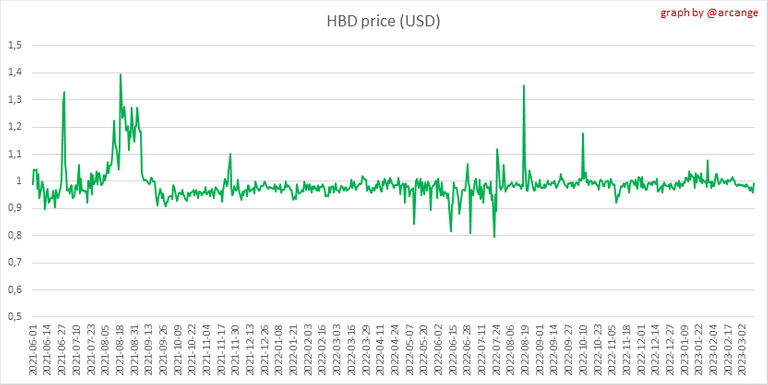 |
These graphs show the evolution of prices in USD for HIVE and HBD.
2. Supply
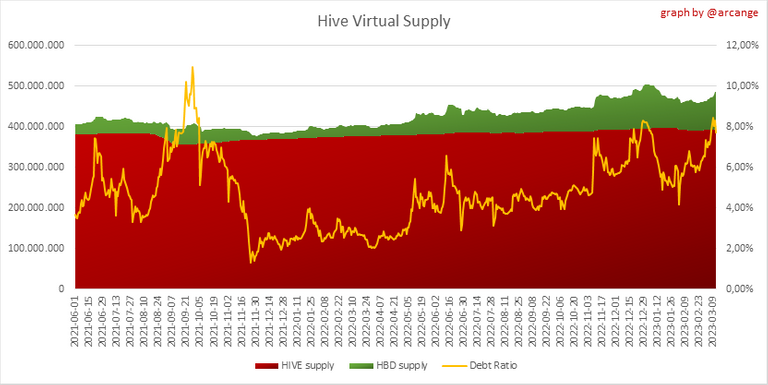
This graph shows the evolution of HIVE virtual Supply. The virtual supply is the sum of HIVE supply (liquid and staked HIVE) and HBD supply (converted into HIVE).
The graph also displays the debt ratio (HBD supply / HIVE virtual supply). Keep in mind that since hardfork 24 funds in the treasury (@hive.fund HBD balance) don't count towards the HBD debt ratio.
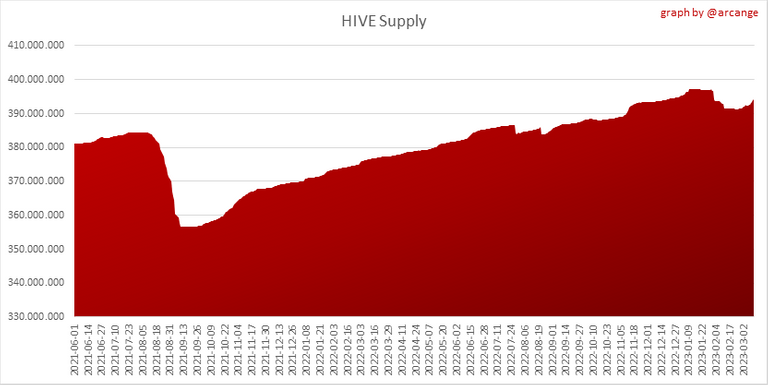 | 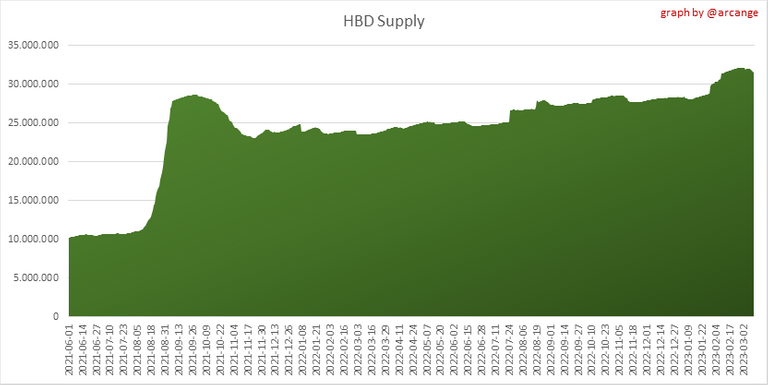 |
These graphs show the evolution of the HIVE Supply (both liquid and staked) and the HBD supply.
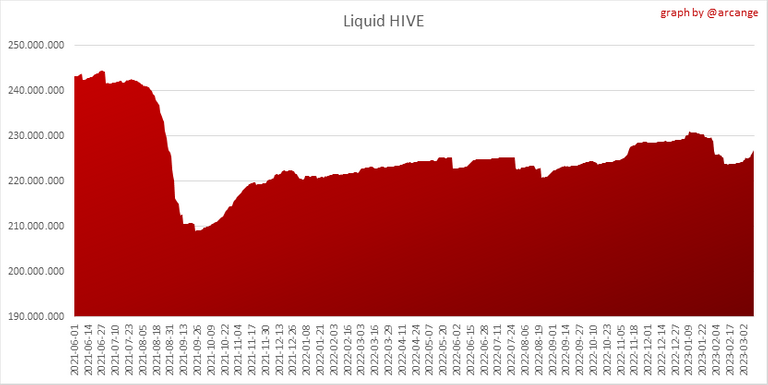 | 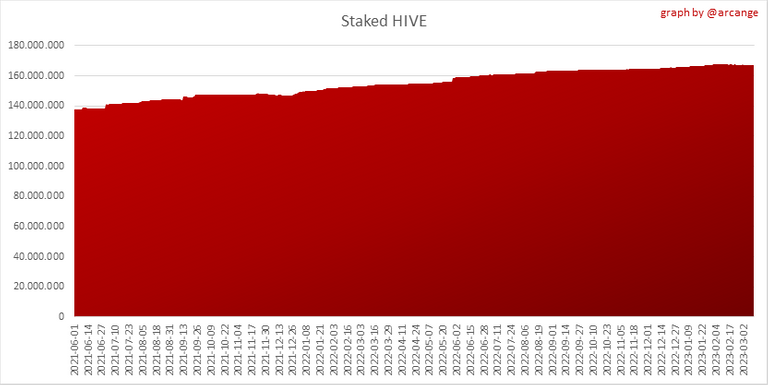 |
These charts show the evolution of the liquid HIVE and the staked HIVE (Hive Power).
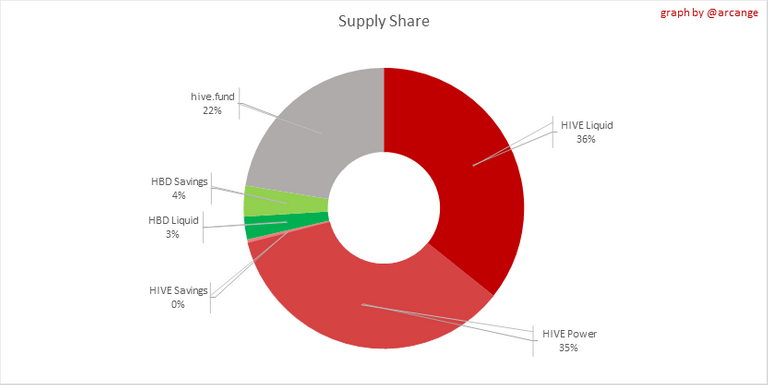
This graph shows the overall Hive tokens distribution.
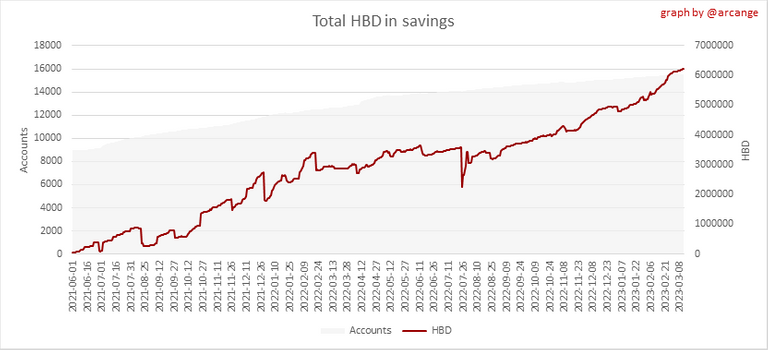
3. HBD Savings
| Account | Deposit | Account | Withdrawal |
|---|---|---|---|
| @anomadsoul | 7,000.000 HBD | @dsavings | 4,000.000 HBD |
| @goldrooster | 4,079.956 HBD | @michiel87 | 1,324.845 HBD |
| @sydechan | 1,340.032 HBD | @rsstarpro | 1,000.000 HBD |
| @vlemon | 986.916 HBD | @abelfotografia | 1,000.000 HBD |
| @lazy-ninja | 703.391 HBD | @niallon11 | 997.524 HBD |
| @cwow2 | 206.595 HBD | @meesterboom | 700.000 HBD |
| @beststart | 206.357 HBD | @demotruk | 700.000 HBD |
| @sussy | 112.000 HBD | @globalcurrencies | 382.800 HBD |
| @engineeringhub | 105.000 HBD | @hallmann | 300.000 HBD |
| @hivefpl | 104.627 HBD | @bnb-hbd | 293.700 HBD |
This graph shows how much and how many accounts store HBD in savings. The table below shows the topmost HBD deposits and withdrawals of the day.
Note: As of 2021-06-30 (HF25) interest is only paid for HBD which are stored in savings.
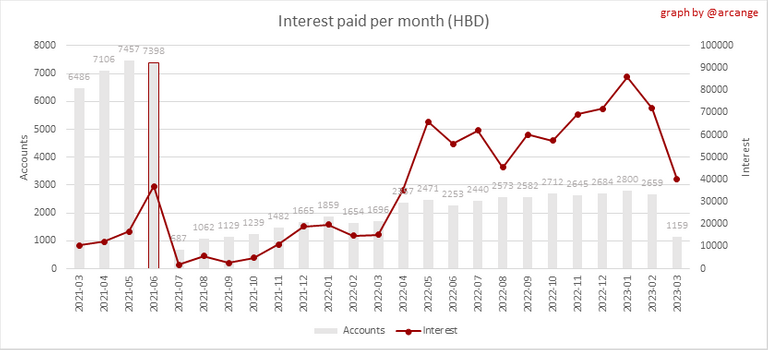
This chart shows the amount of interest paid each month for holding HBD and how many accounts received such interest.
4. Balances
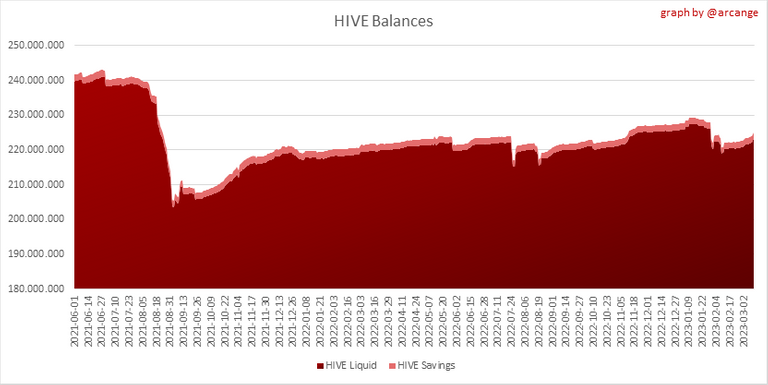
This graph shows the number of HIVE, both liquid and in savings, held by all accounts.
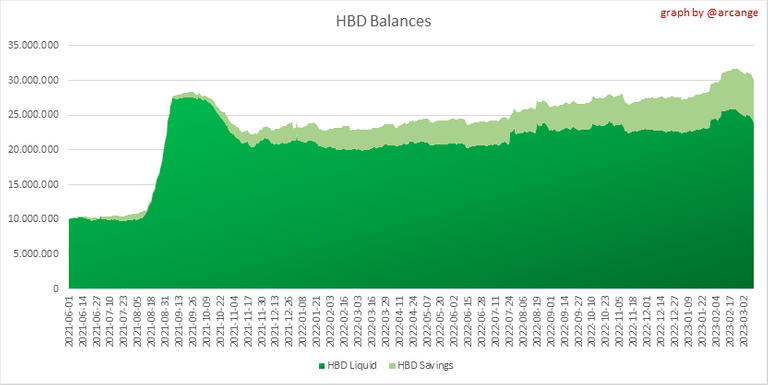
This graph shows the number of HBD, both liquid and in savings, held by all accounts.
5. Conversions
Note: As a reminder, conversion requests are only finalized after 3 days. It is only then that it is known exactly how many HIVE were burned in return for the HBD received at the time of the conversion request.
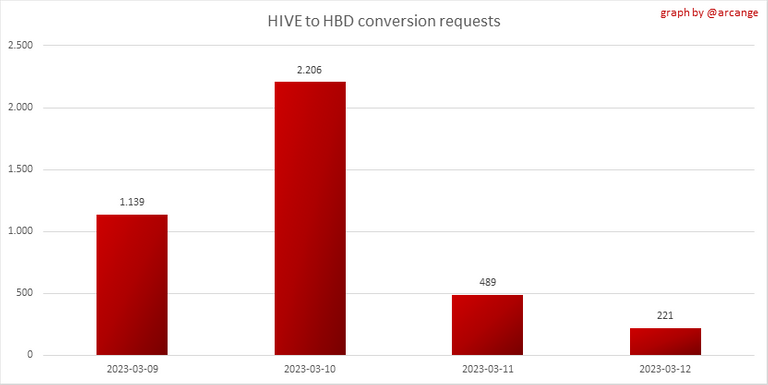
This graph shows the number of HIVE collateralized due to requests to convert HIVE to HBD over the past few days.
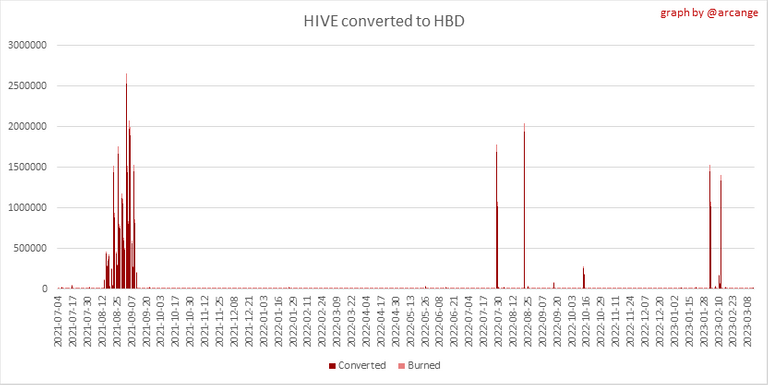 | 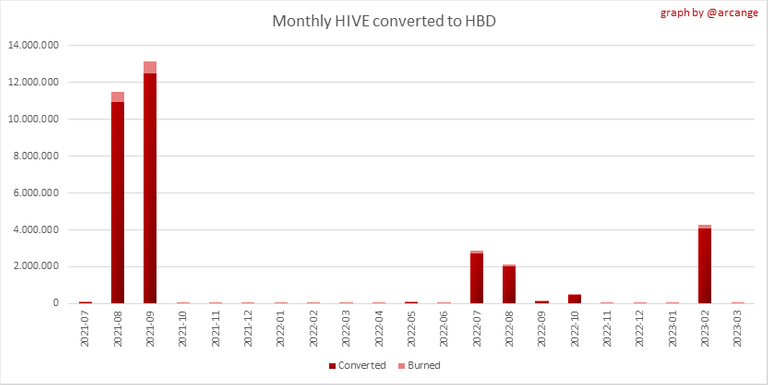 |
These graphs show the number of HIVE effectively used by the conversion process (HIVE converted and 5% HIVE fee which is burned) each day and month when requests to convert HIVE to HBD have been finalized.
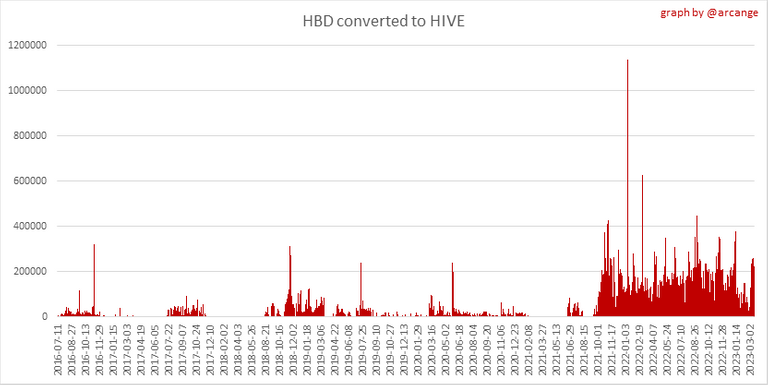 | 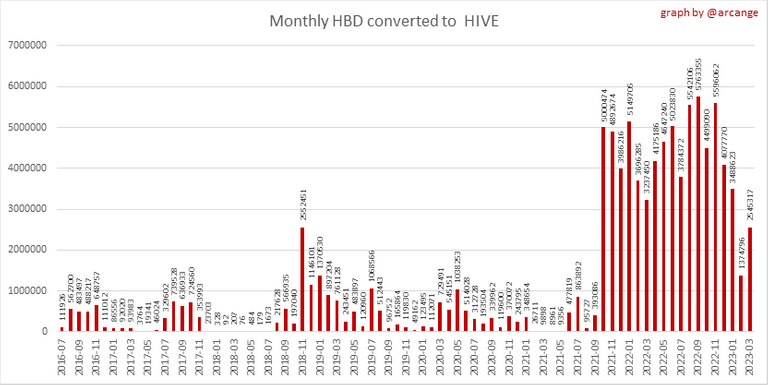 |
These graphs show the number of HBD burned, each day and each month, following requests to convert HBD to HIVE.
6. Powerup and Powerdown
| Date | Account | Amount |
|---|---|---|
| 2023-03-12 11:26:15 | @guiltyparties | 39,000.488 HIVE |
| 2023-03-12 09:02:42 | @eroche | 14,021.501 HIVE |
| 2023-03-12 10:18:27 | @moriarty95 | 7,000.115 HIVE |
| 2023-03-12 05:45:18 | @vlemon | 3,027.634 HIVE |
| 2023-03-12 08:47:15 | @nathyortiz | 1,314.028 HIVE |
| 2023-03-12 07:52:57 | @hive-143869 | 1,059.069 HIVE |
| 2023-03-12 10:30:21 | @josevillanueva | 1,048.016 HIVE |
| 2023-03-12 10:07:39 | @cryptovaults | 1,000.017 HIVE |
| 2023-03-12 06:58:54 | @bambuka | 817.392 HIVE |
| 2023-03-12 11:59:12 | @familia.linares | 720.483 HIVE |
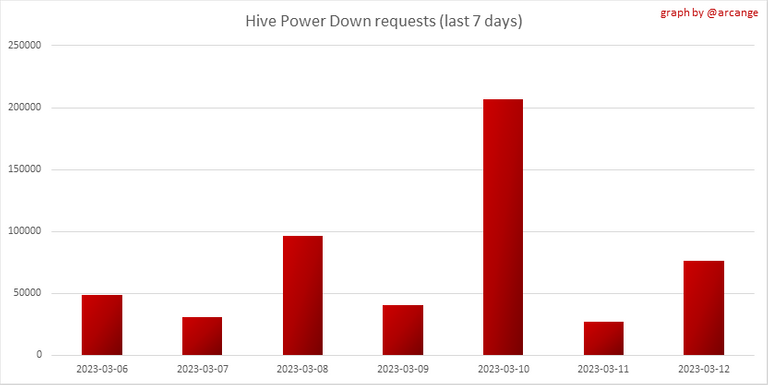
This graph and table show the amount of powerdown initiated over the last 7 days, and the largest initiated on this day.
| Account | Powerup | Account | Powerdown |
|---|---|---|---|
| @vlemon | 2,039.000 HIVE | @ocd-witness | 6,851.866 HIVE |
| @jgiordi | 1,141.847 HIVE | @god0 | 3,867.820 HIVE |
| @rsstarpro | 1,000.000 HIVE | @urri2020 | 2,482.366 HIVE |
| @georgehive | 947.043 HIVE | @deathwing | 2,007.715 HIVE |
| @foodchunk | 876.418 HIVE | @choppy | 1,773.402 HIVE |
| @terracore | 810.148 HIVE | @roleerob | 1,608.678 HIVE |
| @abrockman | 500.000 HIVE | @curie | 1,505.787 HIVE |
| @queengaga | 349.623 HIVE | @acom | 1,475.598 HIVE |
| @sydechan | 298.627 HIVE | @bryan-imhoff | 951.510 HIVE |
| @ecoinstats | 240.000 HIVE | @michiel87 | 881.313 HIVE |
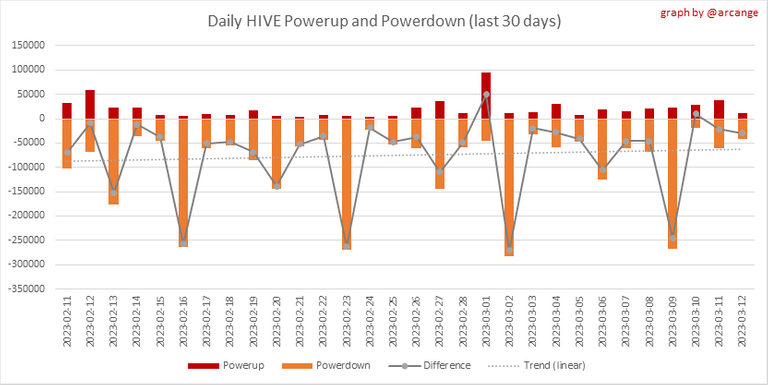
This graph shows the daily HIVE power-up, power-down, and the resulting variation over the last 30 days. The table shows the topmost power-ups and power-downs of the day.
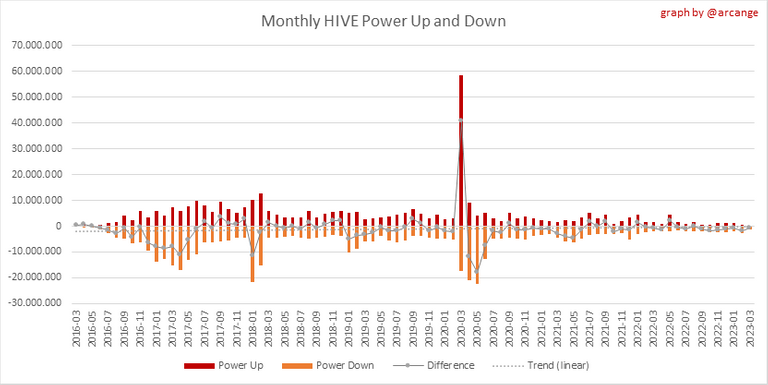
This graph shows the monthly HIVE power-up, power-down and the resulting variation.
Values for the last 3 months
| Period | Powerup | Powerdown | Difference |
|---|---|---|---|
| 2023-03 | 314,679.000 | 1,108,936.000 | -794,257.000 |
| 2023-02 | 606,221.000 | 2,537,169.000 | -1,930,948.000 |
| 2023-01 | 1,360,922.000 | 1,914,402.000 | -553,480.000 |
7. Transfers
These graphs show the volume (in USD) of HIVE and HBD transferred between accounts.
8. Exchanges
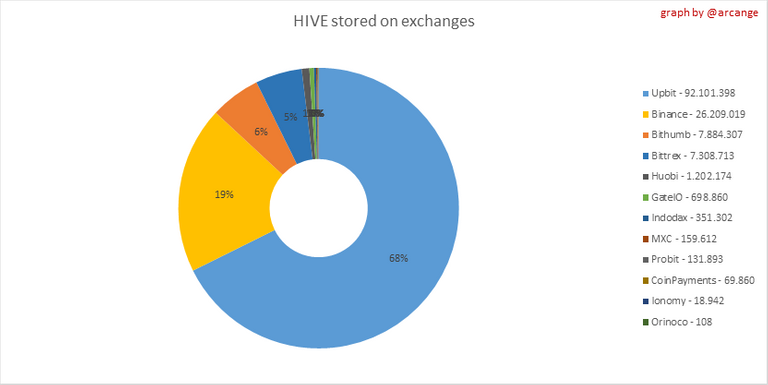 | 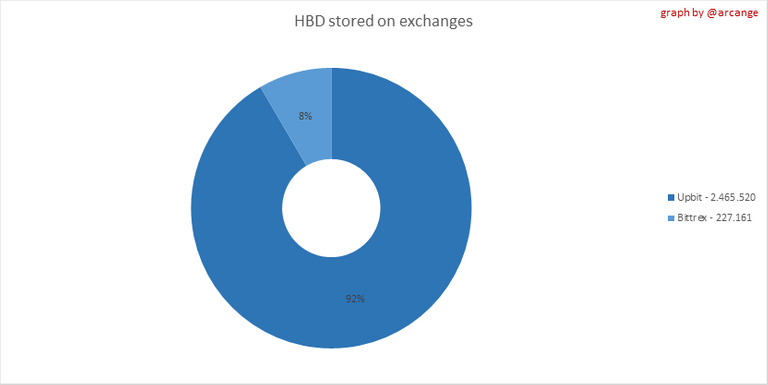 |
These graphs show the amount and distribution of HIVE and HBD stored on the exchanges where they are listed.
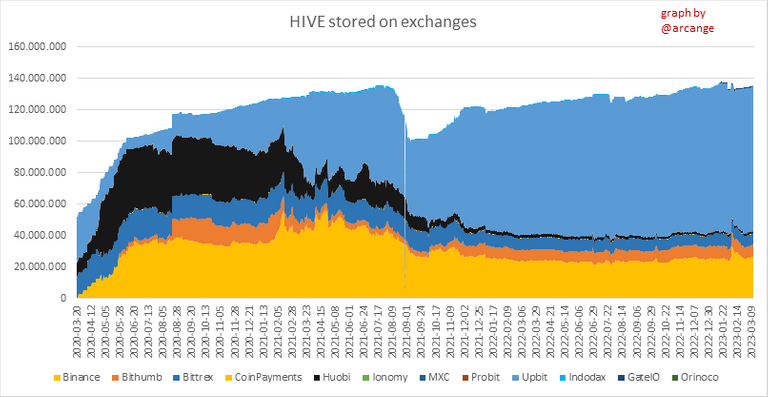 | 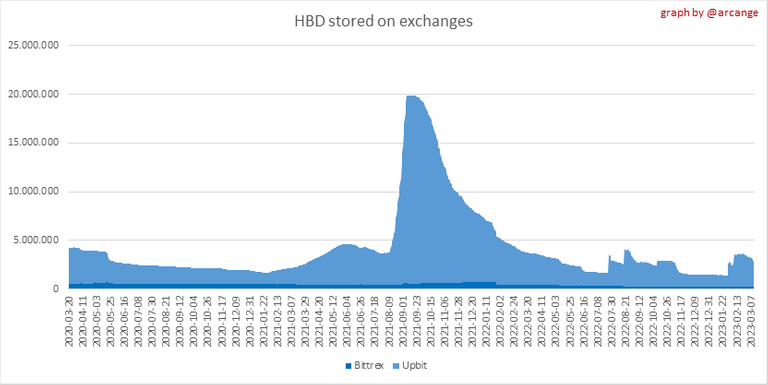 |
These graphs show the daily evolution of HIVE and HBD stored on the exchanges where they are listed.
I hope you find those stats useful. If you would like to see additional stats, feel free to drop me a comment. Your feedback is than welcome.
Thanks for reading.
Check out my apps and services


Nice report, @arcange
Great job running the data.
!CTP
!ALIVE
@arcange! You Are Alive so I just staked 0.1 $ALIVE to your account on behalf of @beststart. (2/10)
The tip has been paid for by the We Are Alive Tribe through the earnings on @alive.chat, feel free to swing by our daily chat any time you want.

Thank you @beststart
!LUV
@beststart, @arcange(1/4) sent you LUV. | tools | discord | community | HiveWiki | <>< daily
View or trade
BEER.Hey @arcange, here is a little bit of
BEERfrom @pixresteemer for you. Enjoy it!Did you know that <a href='https://dcity.io/cityyou can use BEER at dCity game to buy cards to rule the world.
https://twitter.com/1269307561792151555/status/1635153549679288320
The rewards earned on this comment will go directly to the people( @polish.hive ) sharing the post on Twitter as long as they are registered with @poshtoken. Sign up at https://hiveposh.com.
Cheers for the report @arcange
Thank you @jgiordi
!BEER
Congratulations @arcange! You have completed the following achievement on the Hive blockchain And have been rewarded with New badge(s)
Your next target is to reach 760000 upvotes.
You can view your badges on your board and compare yourself to others in the Ranking
If you no longer want to receive notifications, reply to this comment with the word
STOPTo support your work, I also upvoted your post!
Check out our last posts:
Congratulations @arcange!
You raised your level and are now a Whale!
Check out our last posts: