Graphing my power usage with Python
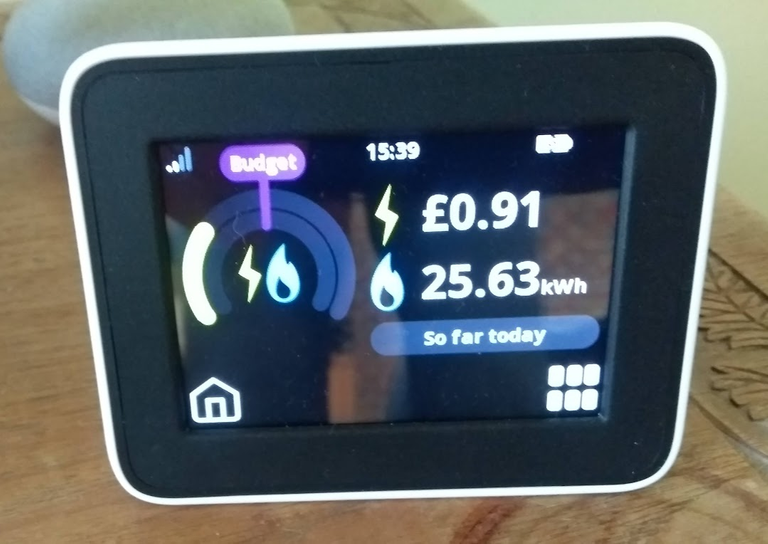
We get our electricity and gas from a company called Octopus. We were with the Co-op, but their operation got taken over. We just had 'smart' meters fitted by them, so they can take readings without me needing to do it. They also gave us a unit so we can see what we are using. It seems to have lost track of the gas price, so we can only see the units.
I then found out that they have a REST API that lets me extract data that they get from my meters. You need an API key to access it that I will not be giving out. I have been looking for projects to work on with Python and doing something with this data looked like a good one.
They supplied me with some curl commands that would fetch the data. From those I could see that it was JSON data and get some idea of the format. It was basically a header followed by a series of readings. There are other things you can access that I have not looked into yet.
I quite like using Jupyter Notebooks as they allow you to play with the code and instantly see the results. You just have to run it and it pops up in your browser. You can enter and run blocks of code.
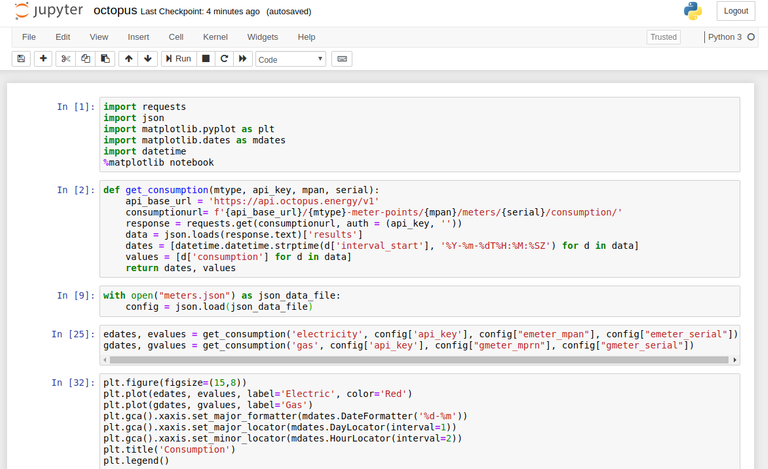
I used the requests library to do the fetching. I did not want to expose my API key or meter IDs, so I have stored those in a config file, also using JSON. I created that file with a script, but it is easily edited as it is just text. The code for querying each meter was the same, so it was natural to create a function.
I had to convert the returned JSON data into a dictionary. One element of that was the results which was a list of dictionaries. Each item had a value and date/time. I used list comprehension to extract that into a couple of lists I could use to plot it.
Then it was just a matter of creating a plot. I used matplotlib, which I have used at work. It can create any sort of plot you want, but can be fiddly to get the exact look you want. I may need to look at some of the alternatives.
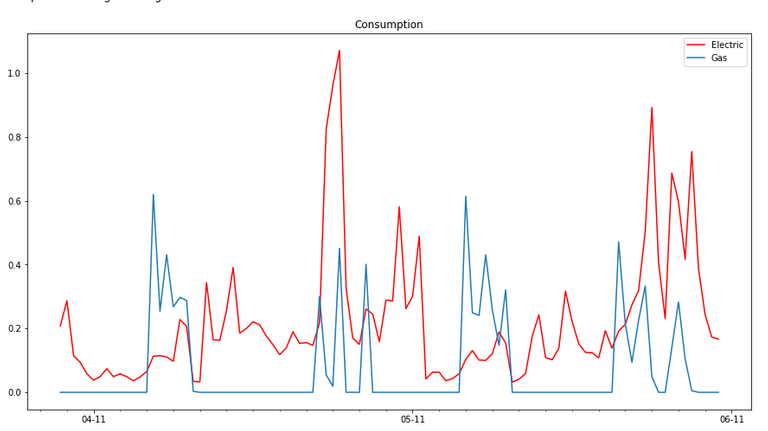
This is what I got. It seems you get the latest three days, but there may be ways to get more. It shows that we use just about all the gas in a couple of blocks in the morning and evening. Electricity is more variable. The big spikes are likely to be from our electric oven, washing machine and dishwasher. The tumble-dryer may also have been on. Some of the family are around during the day, or consumption would be lower. Computers, TVs and consoles will consume a fair bit between them.
I will have to see what else I can do with the data. I am not sure it will reduce our usage much as we are already fairly careful. The advertising for smart meters says they can save you money, but only if they make you aware of wastage. I would quite like to have a display panel on a wall that I could use to display things like this, but it has to be family friendly. A Raspberry Pi could run the software quite easily.
I have put the code on Github in case you want a closer look. As it stands it will only be of direct use to other Octopus customers or if your supplier uses a very similar API.
Happy coding!
It's easy for you to guy here we many time get the bill with more usage and then it takes months to correct them overall its very tiring here
Well you have to work with what is available for you. Providers in the UK may be more organised than elsewhere.
I tagged it with Python as that is the language I used. Nothing to do with snakes.
lol you got me there
Thats amazing awesome. I wish I could make something like that but ComEd isn't as open. Their own app only tells me how much I used in the past day after waiting about 2 days.
I wish more companies could let us use our own data. There's lots of other open data out there though to play with.
For sure. I'm interested in learning a lot more about my activities and its why Hive interests me so much. All the data is out there and I can easily check it whenever I want. Plus I can automate a lot of my actions which is cool to just watch.
I want to look at what I can automate around Hive, but I like to keep control.
Thanks, for this awesome example. I have been looking for a way to store credentials for some time and really like your use of json. Always learning and stretching my brain.
I don't always know what other people are doing, but a quick search found this suggestion. I don't mind if people suggest better alternatives as I am happy to learn.
Do you have a link?
I think this is what inspired me. There are some other options. YAML is used by some apps. There are dedicated libraries for retrieving config too.
Thanks, awesome link.
This is pretty cool. We got smart meters installed at our house a while ago so I can see everything online. It is pretty cool so far. I actually don't go into it as much as I thought I would. They compare you to the average for your neighborhood, so you can see how you are doing compared to others (in general terms).
I think it is useful to see what others use, but it would need to be for a similar size house and number of people. What you really need to know is where the wastage is. That is harder to detect.
Sounds like a good project work, My son has got python in standard 8 this year, so I think, he should have a look at this.
I change suppliers when the deal runs out, that's usually every 18 months, otherwise you are put on the most expensive rate they can dish out. You should too. uSwitch give you around £25 for it as well as a better deal.
Does the UK really have much competition on electricity?
Yes, and Gas. As well as the big boys, there's smaller suppliers like the one @steevc uses now.
I'll check now and then and have changed suppliers a few times. I don't know why they have to have so many tariffs. In the end it's the same electricity and gas. Just give me the best deal you can!
what is #python for?