Is it really this easy to time the BTC top?
A pretty reliable topping signal says we still gots room to run
A chart of Bitcoin's RSI (Relative Strength Index) is showing that we are getting near a possible top, but we aren't there yet.
We are now above 90 and firmly in the party zone.
Above 90 is when the most explosive gains have been realized.
However, it also means a top and drop is probably within the next several months.
Here's the latest:
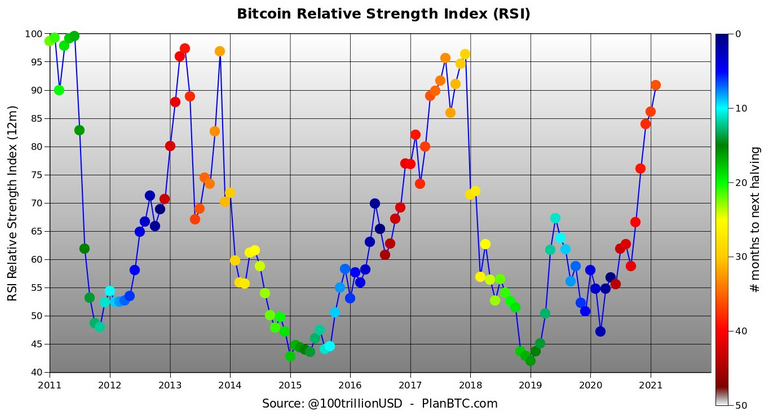
(Source: https://twitter.com/100trillionUSD/status/1360632132994007045/photo/1)
Going off of what happened the last two times we got above this level, it looks like as we transition into the orange dots, the price will keep climbing as will the RSI.
Then, after a few more months, it looks like we probably get a very sizable drop, something north of 30%.
From there it looks like we rally again to all time highs and the RSI gets back to those highs.
The color of the dot will be orange-ish yellow based on history.
My guess is this summer will be a good time to lock some gains before a fall dip.
Then we have that blow off top of the year.
This almost seems too easy at this point, which probably means something unexpected is coming. Be ready.
Posted Using LeoFinance Beta