Hive Financial Statistics – 2021.11.01

Welcome to the daily financial report about the Hive blockchain.
All the information presented in this report is based on the data collected from the blockchain until 2021-11-01 midnight UTC. This report aims to provide you with a clear view of what is happening on the Hive blockchain.
 Este post está traducido al español - aquí
 Dieser Beitrag ist ins Deutsche übersetzt - hier
 Une version en français de ce post est disponible - ici
1. Price
 |  |
These graphs show the evolution of prices in USD for HIVE and HBD.
2. Supply
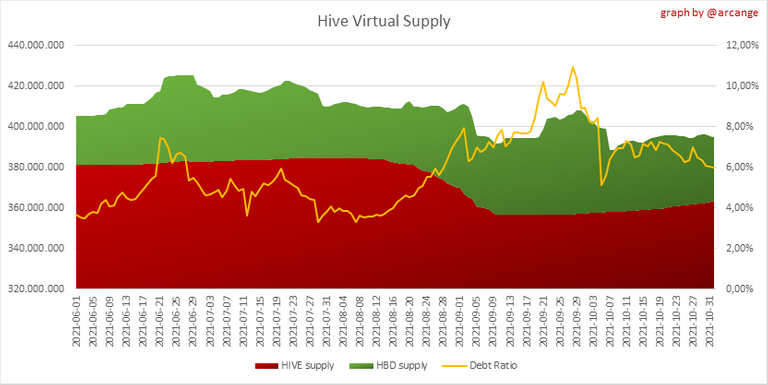
This graph shows the evolution of HIVE virtual Supply. The virtual supply is the sum of HIVE supply (liquid and staked HIVE) and HBD supply (converted into HIVE).
The graph also displays the debt ratio (HBD supply / HIVE virtual supply). Keep in mind that since hardfork 24 funds in the treasury (@hive.fund HBD balance) don't count towards the HBD debt ratio.
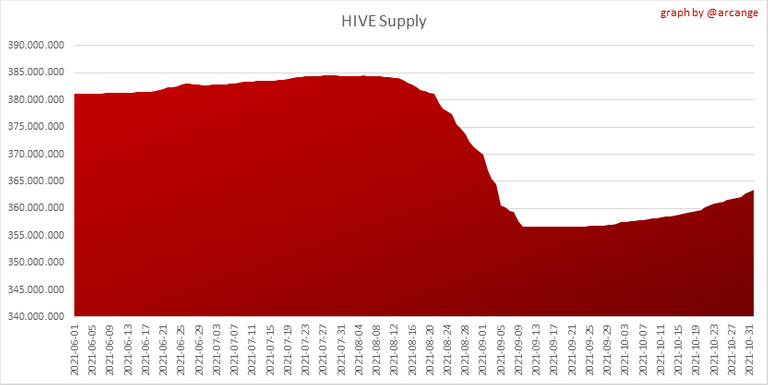 | 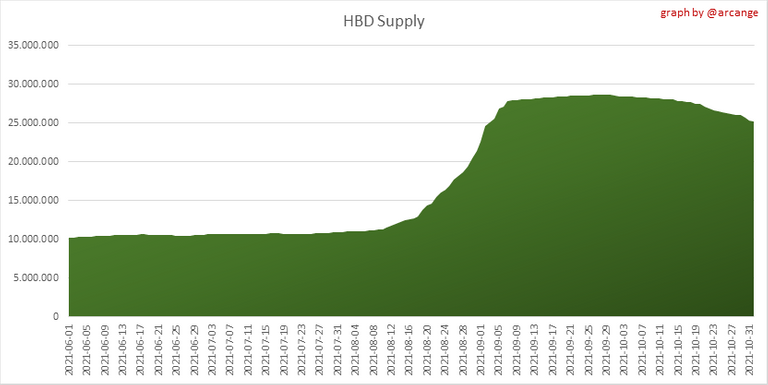 |
These graphs show the evolution of the HIVE Supply (both liquid and staked) and the HBD supply.
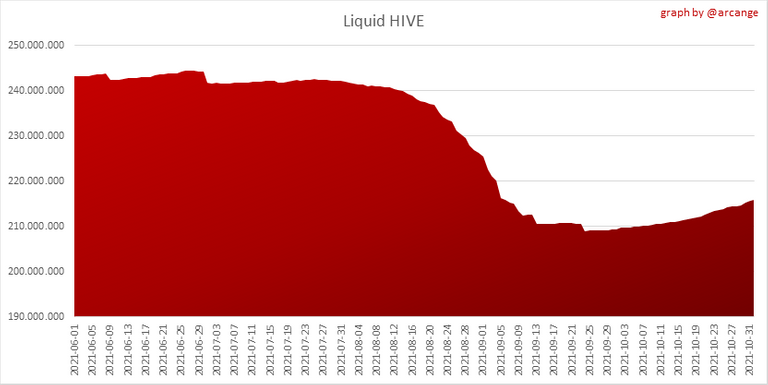 | 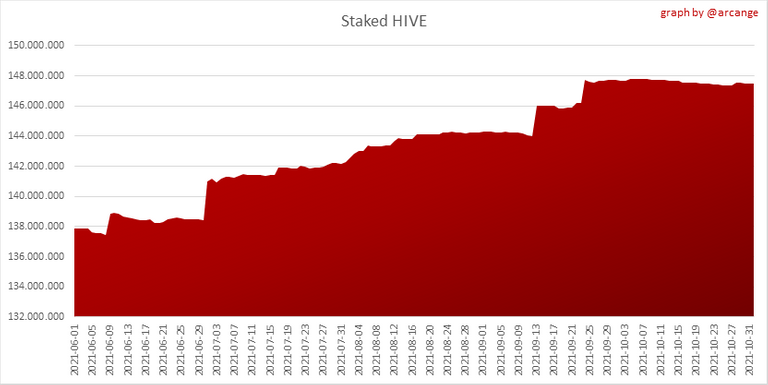 |
These charts show the evolution of the liquid HIVE and the staked HIVE (Hive Power).
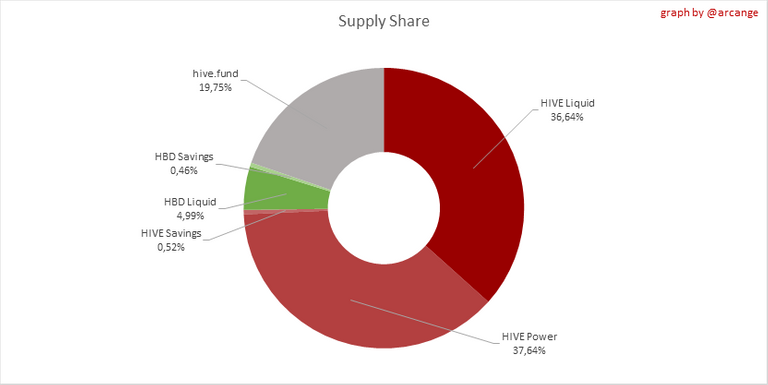
This graph shows the overall Hive tokens distribution.
3. HBD Savings
Note: As of 2021-06-30 (HF25) interest is only paid for HBD which are stored in savings.
| Account | Deposit | Account | Withdrawal |
|---|---|---|---|
| @oflyhigh | 955.897 HBD | @queenbella29 | 8.244 HBD |
| @belemo | 365.057 HBD | @yayogerardo | 6.927 HBD |
| @yunnie | 287.197 HBD | @magnacarta | 5.153 HBD |
| @anggreklestari | 158.196 HBD | @bearmol | 3.852 HBD |
| @denmarkguy | 115.000 HBD | @jerrytsuseer | 3.095 HBD |
| @brianoflondon | 100.000 HBD | @huesos | 2.922 HBD |
| @sgbonus | 100.000 HBD | @kwskicky | 2.808 HBD |
| @ninahaskin | 87.000 HBD | @steamloled | 0.300 HBD |
| @netherhawk | 81.927 HBD | @tatoodrose4 | 0.231 HBD |
| @the-sports-nerd | 77.391 HBD | @charsdesign | 0.121 HBD |
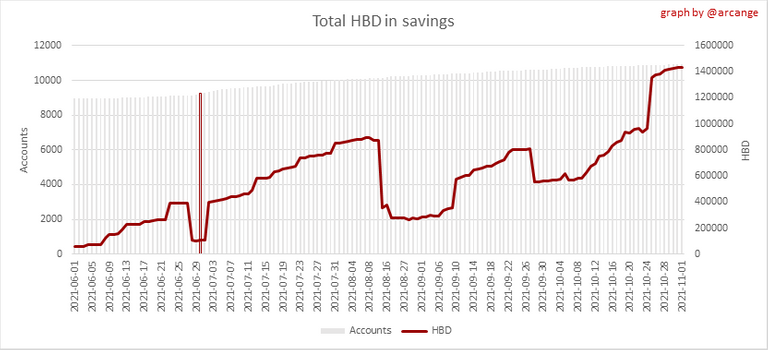
This graph shows how much and how many accounts store HBD in savings. The table below shows the topmost HBD deposits and withdrawals of the day.

This chart shows the amount of interest paid each day for holding HBD and how many accounts received such interest.

This chart is the same as the previous one, but data are grouped by month.
4. Balances
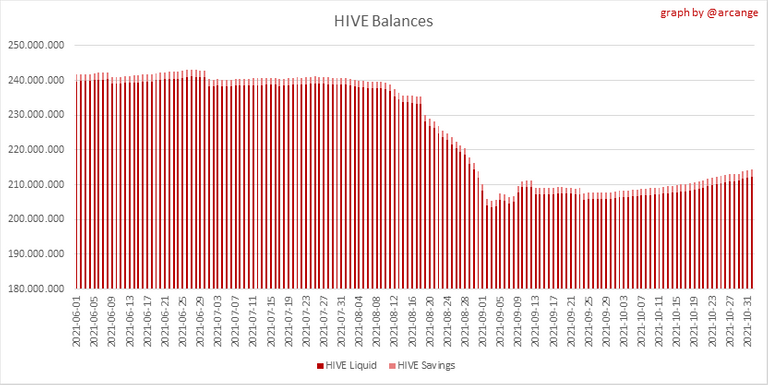
This graph shows the number of HIVE, both liquid and in savings, held by all accounts.
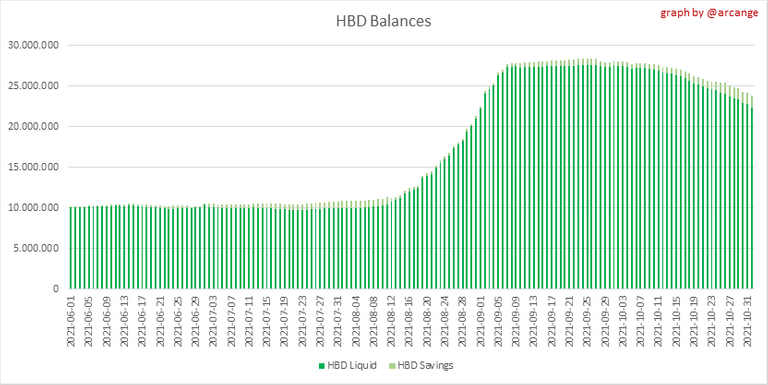
This graph shows the number of HBD, both liquid and in savings, held by all accounts.
5. Conversions
Note: As a reminder, conversion requests are only finalized after 3 days. It is only then that it is known exactly how many HIVE were burned in return for the HBD received at the time of the conversion request.
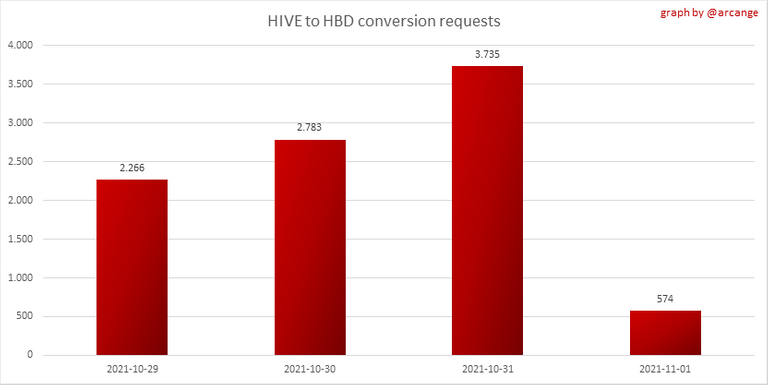
This graph shows the number of HIVE collateralized due to requests to convert HIVE to HBD over the past few days.
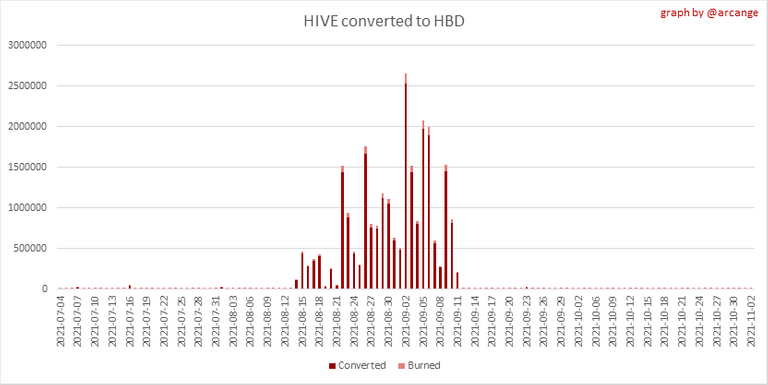 | 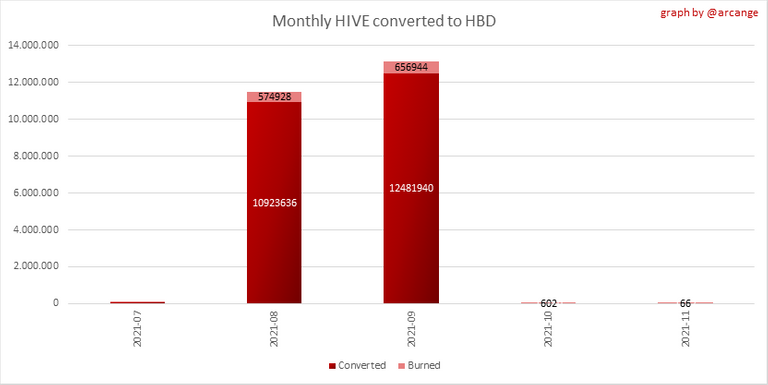 |
These graphs show the number of HIVE effectively used by the conversion process (HIVE converted and 5% HIVE fee which is burned) each day and month when requests to convert HIVE to HBD have been finalized.
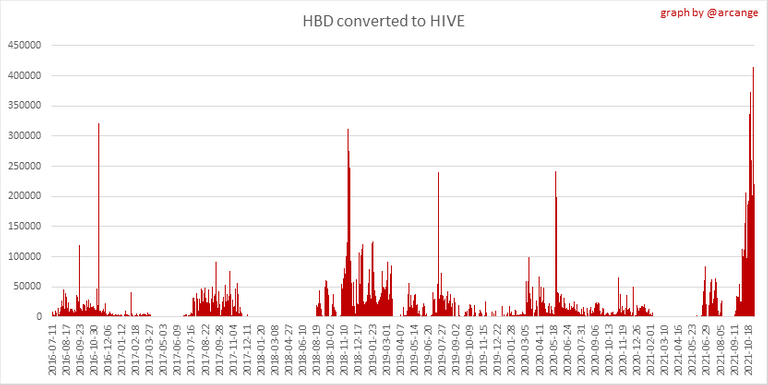 | 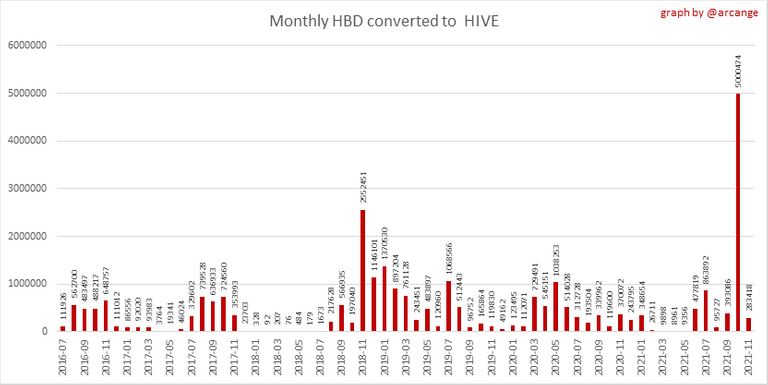 |
These graphs show the number of HBD burned, each day and each month, following requests to convert HBD to HIVE.
6. Powerup and Powerdown

| Date | Account | Amount |
|---|---|---|
| 2021-11-01 05:49:21 | @alokkumar121 | 13,000.715 HIVE |
| 2021-11-01 08:03:54 | @aperterikk | 4,577.217 HIVE |
| 2021-11-01 02:29:30 | @teesart | 4,106.233 HIVE |
| 2021-11-01 01:48:18 | @skinnercrypto | 3,262.111 HIVE |
| 2021-11-01 07:36:00 | @junkfeathers | 2,238.062 HIVE |
| 2021-11-01 02:25:00 | @isabelpena | 2,000.847 HIVE |
| 2021-11-01 01:29:57 | @jarotondi | 1,476.937 HIVE |
| 2021-11-01 09:09:00 | @actifit.pay | 1,400.118 HIVE |
| 2021-11-01 01:00:27 | @thereikiforest | 1,400.100 HIVE |
| 2021-11-01 02:57:21 | @runridefly | 1,258.830 HIVE |
This graph and table show the amount of powerdown initiated over the last 7 days, and the largest initiated on this day.
| Account | Powerup | Account | Powerdown |
|---|---|---|---|
| @kryptodenno | 6,000.000 HIVE | @gringalicious | 14,906.847 HIVE |
| @starthilfe | 3,145.899 HIVE | @peakd | 12,335.776 HIVE |
| @cmplxty | 2,090.000 HIVE | @aggroed | 6,940.422 HIVE |
| @m31 | 1,976.101 HIVE | @chronocrypto | 5,300.773 HIVE |
| @dalersilfver | 1,486.299 HIVE | @roelandp | 3,352.507 HIVE |
| @mciszczon | 1,400.000 HIVE | @xxxxxxxxxx | 3,239.072 HIVE |
| @braaiboy | 1,395.373 HIVE | @eric818 | 2,928.546 HIVE |
| @eghnim | 1,365.749 HIVE | @leo.voter | 1,900.091 HIVE |
| @forykw | 1,023.841 HIVE | @ua-promoter | 1,645.247 HIVE |
| @stayoutoftherz | 1,015.000 HIVE | @innerhive | 1,557.738 HIVE |
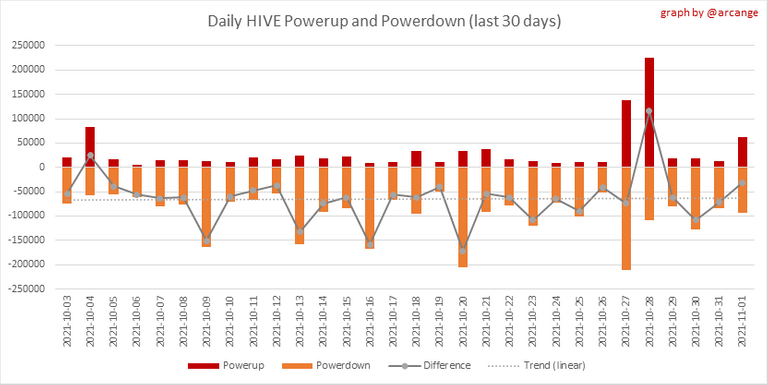
This graph shows the daily HIVE power-up, power-down, and the resulting variation over the last 30 days. The table shows the topmost power-ups and power-downs of the day.
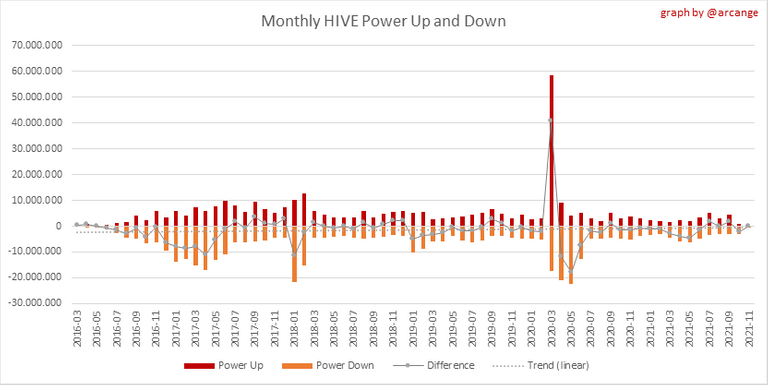
This graph shows the monthly HIVE power-up, power-down and the resulting variation.
Values for the last 3 months
| Period | Powerup | Powerdown | Difference |
|---|---|---|---|
| 2021-11 | 61,807.000 | 92,705.000 | -30,898.000 |
| 2021-10 | 951,900.000 | 3,051,364.000 | -2,099,464.000 |
| 2021-09 | 4,552,777.000 | 2,892,984.000 | 1,659,793.000 |
7. Transfers
These graphs show the volume (in USD) of HIVE and HBD transferred between accounts.
8. Exchanges
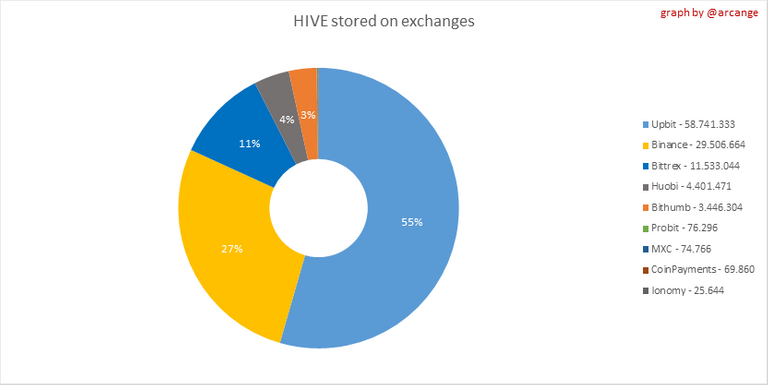 | 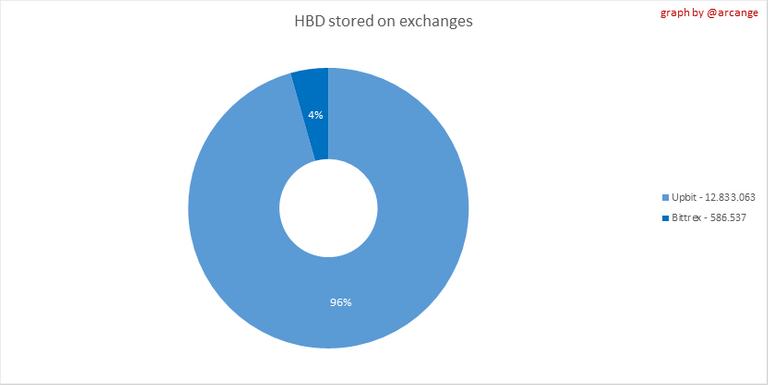 |
These graphs show the amount and distribution of HIVE and HBD stored on the exchanges where they are listed.
 | 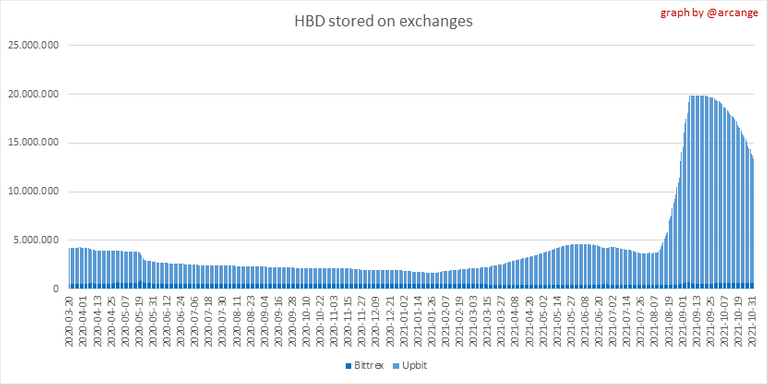 |
These graphs show the daily evolution of HIVE and HBD stored on the exchanges where they are listed.
I hope you find those stats useful. If you would like to see additional stats, feel free to drop me a comment. Your feedback is than welcome.
Thanks for reading.
Check out my apps and services


Vote for me as a witness 

@tipu curate 2
Upvoted 👌 (Mana: 20/100) Liquid rewards.
Thank you for putting together all the graphs, statistical data and financials @arcange📈📊📉
A big round of applause to everyone mentioned for your financial savviness!👏
Upvoted and curated
Thank you @ninahaskin 🌹
You're very welcome!💋
Nice
Good to see the increasing in HBD savings, but bad to see that huge amount of power down recently. What could be in the background of that?
background for "increasing in HBD savings": attractive interest rate
background for "huge amount of power down": as always, people need money or aren't patient enough to hodl and wait for a higher price
I understand both the first and the second too. I just do not understand the reason behind the huge negative difference between the power ups and the power downs recently. For example the difference was positive in 2021 September.
There has been a bit HIVE pump at the beginning of October. Many started to powerdown to take profit.
wow.. thanks for this information @arcange ..
Thank you @queenbella29
Some good numbers! Love that there's what looks like 1.4 million HBD stored in savings! That's awesome!
Thank you for the information @arcange, good job.
Thank you @isabelpena
BTW, do you mind reviewing and supporting the Hive Authentication Services proposal? That would be much appreciated. You can vote for the proposal on Peakd, ecency, Hive.blog or using HiveSigner
Your feedback about the project is welcome too.
Thank you!
Sure friend. Let me review the proposal.
Thank you. Looking forward to getting your vote. 🤗
Apparently my vote is still active, do I understand?
Yes, that's correct. Thank you for your support @isabelpena, really appreciate it! 👍
↑Upvoted↑ and ←Reblogged→
Thank you @jerrytsuseer
You're welcome my friend