Hive Financial Statistics – 2023.04.13

Welcome to the daily financial report about the Hive blockchain.
All the information presented in this report is based on the data collected from the blockchain until 2023-04-13 midnight UTC. This report aims to provide you with a clear view of what is happening on the Hive blockchain.
 Este post está traducido al español - aquí
 Dieser Beitrag ist ins Deutsche übersetzt - hier
 Une version en français de ce post est disponible - ici
1. Price
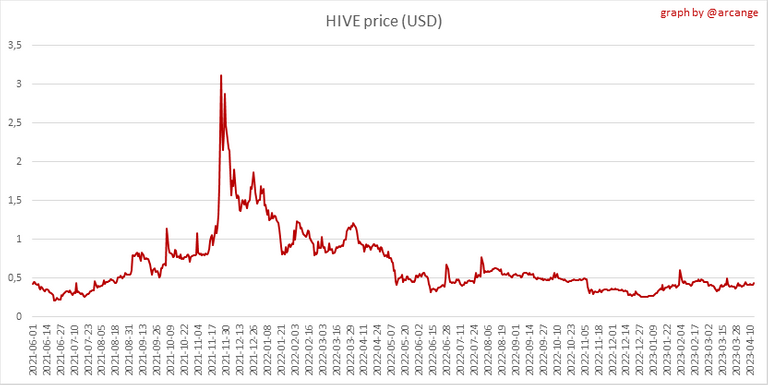 |  |
These graphs show the evolution of prices in USD for HIVE and HBD.
2. Supply
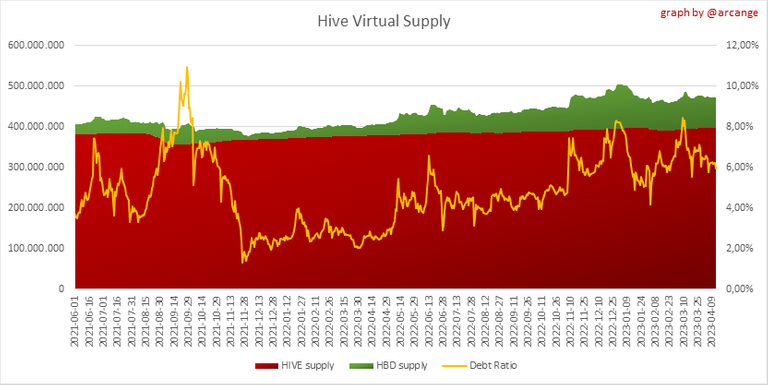
This graph shows the evolution of HIVE virtual Supply. The virtual supply is the sum of HIVE supply (liquid and staked HIVE) and HBD supply (converted into HIVE).
The graph also displays the debt ratio (HBD supply / HIVE virtual supply). Keep in mind that since hardfork 24 funds in the treasury (@hive.fund HBD balance) don't count towards the HBD debt ratio.
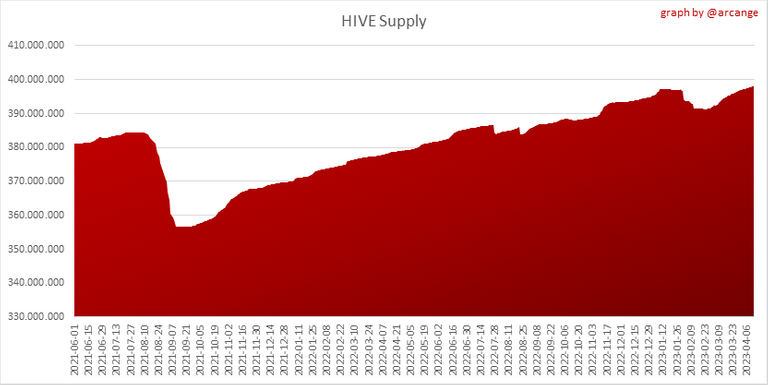 |  |
These graphs show the evolution of the HIVE Supply (both liquid and staked) and the HBD supply.
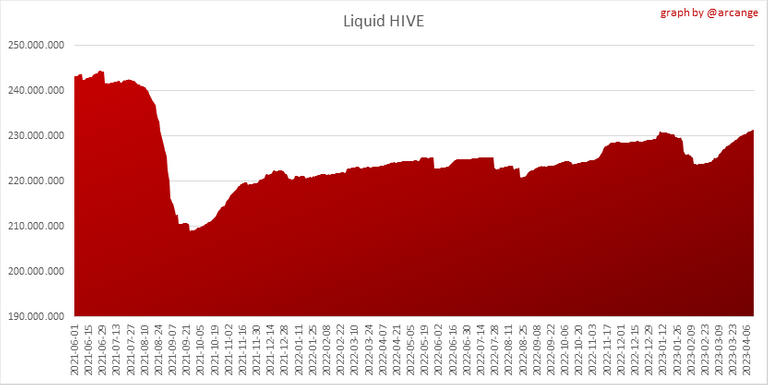 | 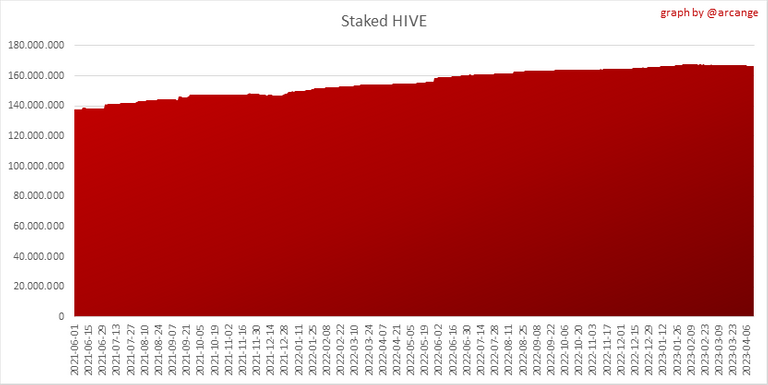 |
These charts show the evolution of the liquid HIVE and the staked HIVE (Hive Power).

This graph shows the overall Hive tokens distribution.
3. HBD Savings

| Account | Deposit | Account | Withdrawal |
|---|---|---|---|
| @resonator | 2,135.965 HBD | @wandereronwheels | 2,252.566 HBD |
| @x9ed1732b.stake | 1,718.302 HBD | @jychbetter | 442.040 HBD |
| @criptosectadepit | 1,174.353 HBD | @mango-juice | 253.000 HBD |
| @florian-glechner | 1,011.594 HBD | @empress-eremmy | 200.000 HBD |
| @pjansen | 817.138 HBD | @rt395 | 184.423 HBD |
| @growandbow | 779.238 HBD | @stevelivingston | 100.000 HBD |
| @privex | 664.243 HBD | @fokusnow | 50.000 HBD |
| @enmymente | 500.000 HBD | @doriangel | 30.017 HBD |
| @pr4ec14rv5 | 481.892 HBD | @valeryc | 25.312 HBD |
| @hiveauth | 324.984 HBD | @sperosamuel15 | 21.859 HBD |
This graph shows how much and how many accounts store HBD in savings. The table below shows the topmost HBD deposits and withdrawals of the day.
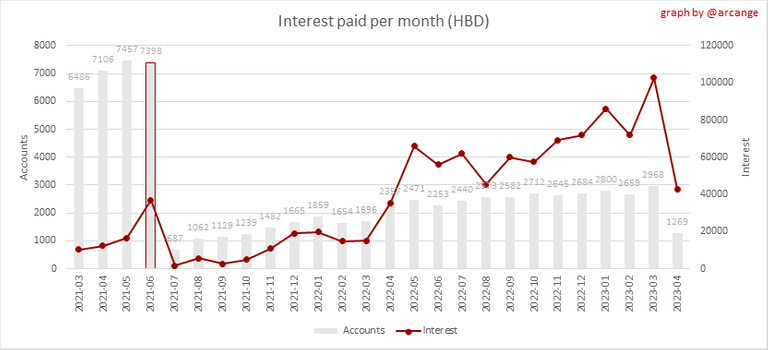
Note: As of 2021-06-30 (HF25) interest is only paid for HBD which are stored in savings.
This chart shows the amount of interest paid each month for holding HBD and how many accounts received such interest.
4. Balances

This graph shows the number of HIVE, both liquid and in savings, held by all accounts.

This graph shows the number of HBD, both liquid and in savings, held by all accounts.
5. Conversions
Note: As a reminder, conversion requests are only finalized after 3 days. It is only then that it is known exactly how many HIVE were burned in return for the HBD received at the time of the conversion request.
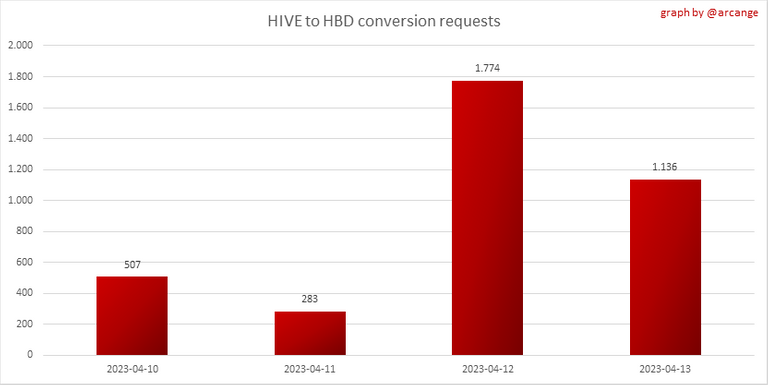
This graph shows the number of HIVE collateralized due to requests to convert HIVE to HBD over the past few days.
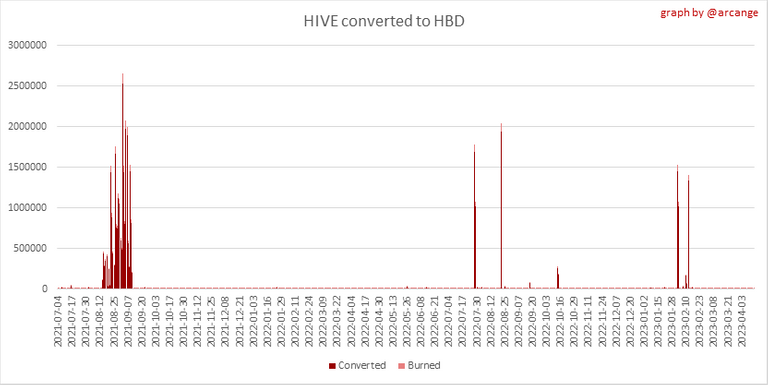 | 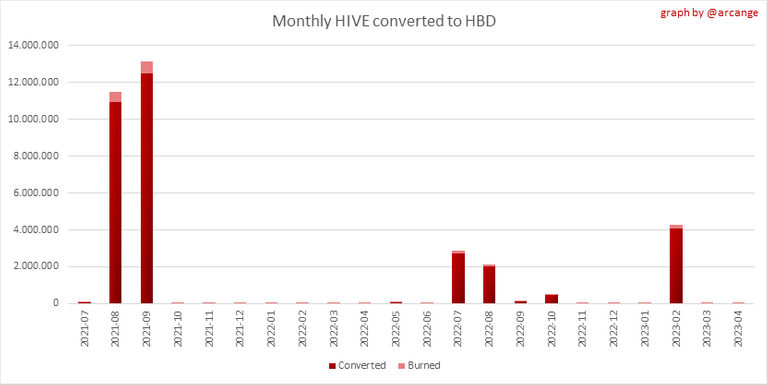 |
These graphs show the number of HIVE effectively used by the conversion process (HIVE converted and 5% HIVE fee which is burned) each day and month when requests to convert HIVE to HBD have been finalized.
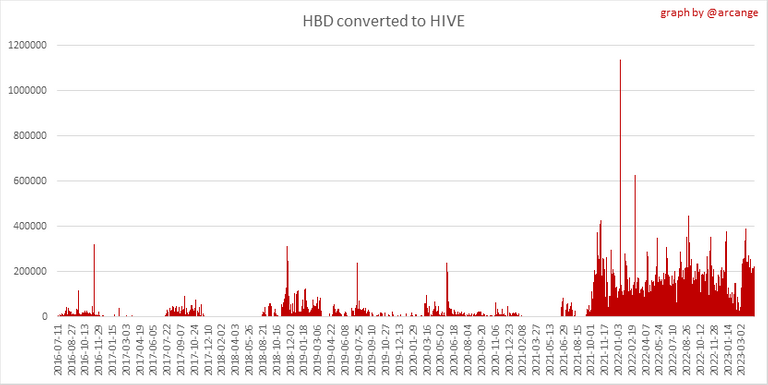 |  |
These graphs show the number of HBD burned, each day and each month, following requests to convert HBD to HIVE.
6. Powerup and Powerdown
| Date | Account | Amount |
|---|---|---|
| 2023-04-13 02:05:27 | @resonator | 67,180.572 HIVE |
| 2023-04-13 02:37:21 | @broncnutz | 65,119.105 HIVE |
| 2023-04-13 10:34:33 | @jaynie | 60,690.212 HIVE |
| 2023-04-13 02:01:42 | @muratkbesiroglu | 31,001.347 HIVE |
| 2023-04-13 11:35:09 | @steemed-proxy | 10,400.127 HIVE |
| 2023-04-13 05:35:24 | @bhattg | 6,638.210 HIVE |
| 2023-04-13 02:53:18 | @teesart | 3,144.837 HIVE |
| 2023-04-13 02:25:15 | @baltai | 2,000.084 HIVE |
| 2023-04-13 08:39:48 | @readthisplease | 1,878.040 HIVE |
| 2023-04-13 11:40:21 | @keritroberts | 1,776.092 HIVE |
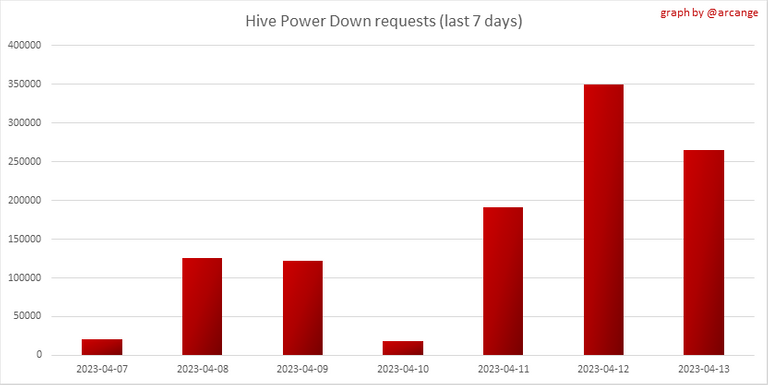
This graph and table show the amount of powerdown initiated over the last 7 days, and the largest initiated on this day.
| Account | Powerup | Account | Powerdown |
|---|---|---|---|
| @alpha-homer | 195,000.000 HIVE | @mottler | 199,251.851 HIVE |
| @elrish10 | 1,242.746 HIVE | @hbdstabilizer | 24,012.237 HIVE |
| @catwomanteresa | 1,000.000 HIVE | @pouchon | 10,724.290 HIVE |
| @farm1 | 798.983 HIVE | @rocky1 | 5,027.766 HIVE |
| @d-company | 444.056 HIVE | @dcityrewards | 3,253.620 HIVE |
| @jagged71 | 400.000 HIVE | @guiltyparties | 3,078.633 HIVE |
| @firstamendment | 316.710 HIVE | @steempeak | 2,805.792 HIVE |
| @deanliu | 300.000 HIVE | @pgarcgo | 2,650.241 HIVE |
| @cliffagreen | 191.860 HIVE | @good-karma | 2,625.993 HIVE |
| @melinda010100 | 160.000 HIVE | @yann0975 | 2,385.162 HIVE |
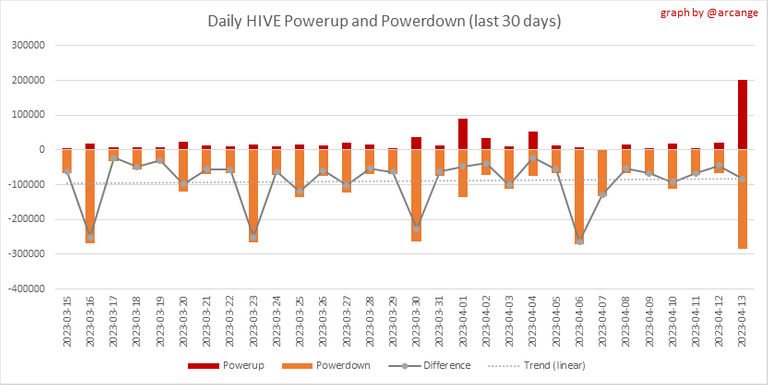
This graph shows the daily HIVE power-up, power-down, and the resulting variation over the last 30 days. The table shows the topmost power-ups and power-downs of the day.
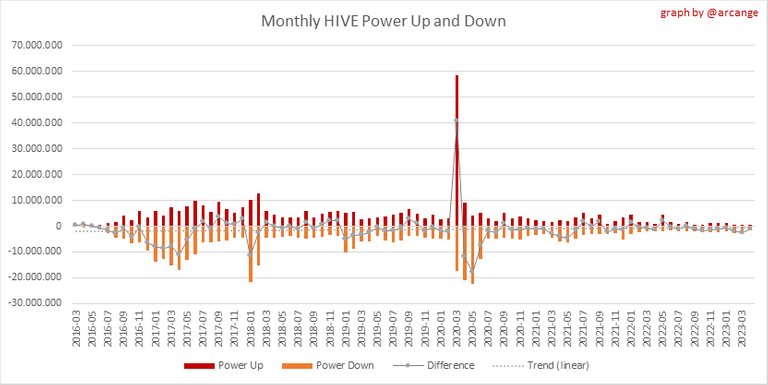
This graph shows the monthly HIVE power-up, power-down and the resulting variation.
Values for the last 3 months
| Period | Powerup | Powerdown | Difference |
|---|---|---|---|
| 2023-04 | 475,981.000 | 1,538,213.000 | -1,062,232.000 |
| 2023-03 | 628,383.000 | 3,155,615.000 | -2,527,232.000 |
| 2023-02 | 606,221.000 | 2,537,169.000 | -1,930,948.000 |
7. Transfers
These graphs show the volume (in USD) of HIVE and HBD transferred between accounts.
8. Exchanges
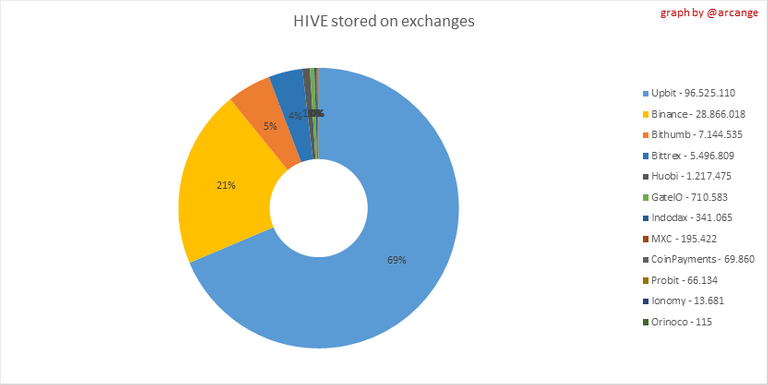 |  |
These graphs show the amount and distribution of HIVE and HBD stored on the exchanges where they are listed.
 | 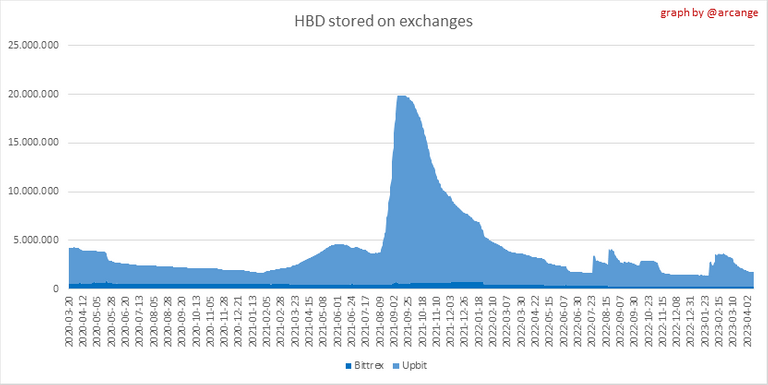 |
These graphs show the daily evolution of HIVE and HBD stored on the exchanges where they are listed.
I hope you find those stats useful. If you would like to see additional stats, feel free to drop me a comment. Your feedback is than welcome.
Thanks for reading.
Check out my apps and services


The information you have shared here makes me realize that there are so many people who believe in Hive.
Nice one!
An Exclusive report 📊
I see hive proceeding into the future in this statistics, hopefully we will return to 1 Hive = 1HBD or more ❤️
Thank you for this updated information regarding the financial status of Hive, HBD and Hive Power. This will serve as a guides among Hive users particularly those newbies who are just learning how Hive really works.
@philnews.xyz, you're welcome! I'm glad you find the information helpful. It's important for both new and experienced Hive users to stay informed about the financial status of the platform.
There is a temporary fall in price of Hive looking at the graph, the same as HBD compare to the Dollar rate. But I think this is short decline and things would be normal soon.
!Nice financial Record...!LOLZ
lolztoken.com
Sigh. That's the story of my life.
Credit: reddit
@arcange, I sent you an $LOLZ on behalf of @uthantzin
(3/8)
Farm LOLZ tokens when you Delegate Hive or Hive Tokens.
Click to delegate: 10 - 20 - 50 - 100 HP
Thank you @uthantzin
View or trade
BEER.Hey @arcange, here is a little bit of
BEERfrom @pixresteemer for you. Enjoy it!Learn how to earn FREE BEER each day by staking your
BEER.It's kind of sad to think that the bitcoin I made from a faucet and forgot about, traded on bittrex to hive before bitrex closed down, and powered up made the top list. Let's see some more life on this platform.
It's true that the crypto market has seen ups and downs, and sometimes it can be a bit disheartening. However, it's essential to remember that the blockchain and cryptocurrency space is still relatively young, and there is significant potential for growth.
The Hive platform, in particular, has been showing signs of progress with new developments, projects, and communities being built around it. As more people become aware of the benefits of decentralized platforms like Hive, we can expect to see increased activity and growth in the future. It's essential to stay positive.