Hive Financial Statistics – 2021.10.16

Welcome to the daily financial report about the Hive blockchain.
All the information presented in this report is based on the data collected from the blockchain until 2021-10-16 midnight UTC. This report aims to provide you with a clear view of what is happening on the Hive blockchain.
 Este post está traducido al español - aquí
 Dieser Beitrag ist ins Deutsche übersetzt - hier
 Une version en français de ce post est disponible - ici
1. Price
 |  |
These graphs show the evolution of prices in USD for HIVE and HBD.
2. Supply

This graph shows the evolution of HIVE virtual Supply. The virtual supply is the sum of HIVE supply (liquid and staked HIVE) and HBD supply (converted into HIVE).
The graph also displays the debt ratio (HBD supply / HIVE virtual supply). Keep in mind that since hardfork 24 funds in the treasury (@hive.fund HBD balance) don't count towards the HBD debt ratio.
 |  |
These graphs show the evolution of the HIVE Supply (both liquid and staked) and the HBD supply.
 | 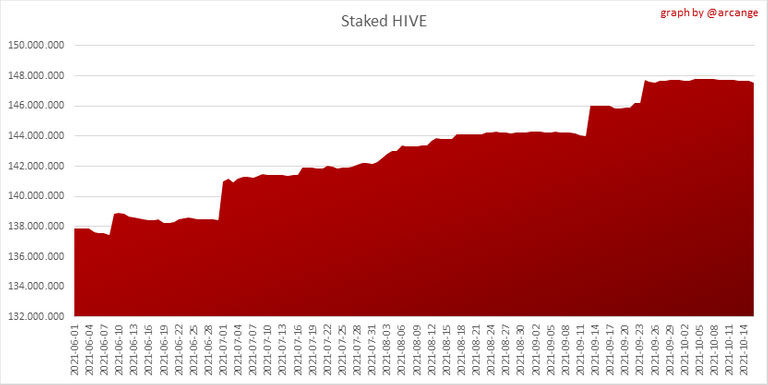 |
These charts show the evolution of the liquid HIVE and the staked HIVE (Hive Power).

This graph shows the overall Hive tokens distribution.
3. HBD Savings
Note: As of 2021-06-30 (HF25) interest is only paid for HBD which are stored in savings.

| Account | Deposit | Account | Withdrawal |
|---|---|---|---|
| @mika | 25,000.000 HBD | @aurealone | 1,000.000 HBD |
| @inertia | 9,001.000 HBD | @mango-juice | 871.037 HBD |
| @muenchen | 3,161.398 HBD | @moleah | 305.351 HBD |
| @ragnarokdel | 188.000 HBD | @opidia | 42.281 HBD |
| @hiq.redaktion | 140.000 HBD | @tub3r0 | 19.478 HBD |
| @darkflame | 101.644 HBD | @jmvanbreda | 18.130 HBD |
| @sam1965uk | 100.142 HBD | @chentebass | 10.053 HBD |
| @thelogicaldude | 74.467 HBD | @centerlink | 7.247 HBD |
| @magicmonk | 73.626 HBD | @frugalgamer | 6.863 HBD |
| @mistural | 48.691 HBD | @lsdmercyy | 4.000 HBD |
This graph shows how much and how many accounts store HBD in savings. The table below shows the topmost HBD deposits and withdrawals of the day.

This chart shows the amount of interest paid each day for holding HBD and how many accounts received such interest.

This chart is the same as the previous one, but data are grouped by month.
4. Balances

This graph shows the number of HIVE, both liquid and in savings, held by all accounts.

This graph shows the number of HBD, both liquid and in savings, held by all accounts.
5. Conversions
Note: As a reminder, conversion requests are only finalized after 3 days. It is only then that it is known exactly how many HIVE were burned in return for the HBD received at the time of the conversion request.
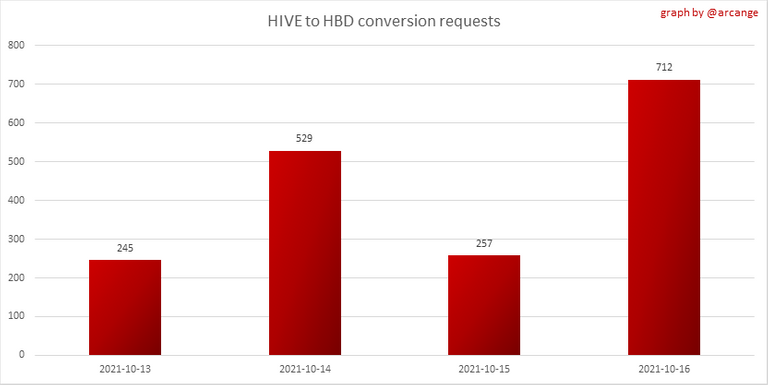
This graph shows the number of HIVE collateralized due to requests to convert HIVE to HBD over the past few days.
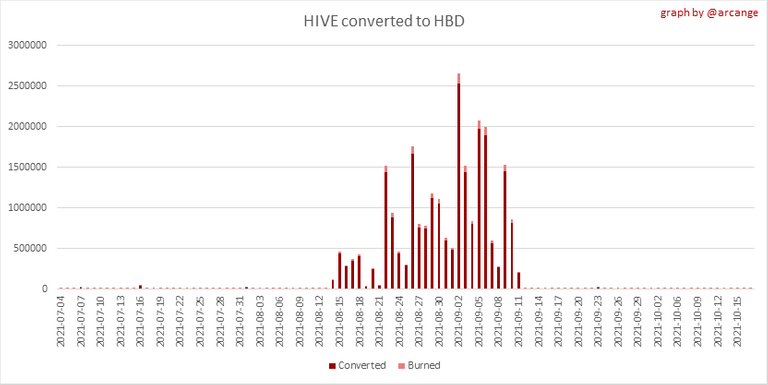 |  |
These graphs show the number of HIVE effectively used by the conversion process (HIVE converted and 5% HIVE fee which is burned) each day and month when requests to convert HIVE to HBD have been finalized.
 |  |
These graphs show the number of HBD burned, each day and each month, following requests to convert HBD to HIVE.
6. Powerup and Powerdown

| Date | Account | Amount |
|---|---|---|
| 2021-10-16 11:43:00 | @ctime | 349,550.307 HIVE |
| 2021-10-16 11:17:54 | @luckyolddaddy | 36,306.843 HIVE |
| 2021-10-16 01:58:21 | @tribesteemup | 28,603.111 HIVE |
| 2021-10-16 07:22:15 | @adambarratt | 26,002.358 HIVE |
| 2021-10-16 05:39:45 | @maks.molotskyy | 23,748.363 HIVE |
| 2021-10-16 10:58:51 | @hansgans | 22,352.625 HIVE |
| 2021-10-16 11:16:57 | @luckyolddaddy | 16,251.261 HIVE |
| 2021-10-16 04:51:21 | @coinomite | 7,873.609 HIVE |
| 2021-10-16 06:21:09 | @pradeepdee6 | 7,456.775 HIVE |
| 2021-10-16 11:07:42 | @spt-skillup | 7,150.268 HIVE |
This graph and table show the amount of powerdown initiated over the last 7 days, and the largest initiated on this day.

| Account | Powerup | Account | Powerdown |
|---|---|---|---|
| @steemitboard | 1,178.445 HIVE | @riverhead | 74,849.684 HIVE |
| @ctime | 774.324 HIVE | @dhimmel | 13,713.769 HIVE |
| @gualteramarelo | 715.779 HIVE | @buildawhale | 5,820.323 HIVE |
| @cranium | 600.000 HIVE | @ohanahealing | 5,237.961 HIVE |
| @steemmillionaire | 570.000 HIVE | @talentclub | 4,005.420 HIVE |
| @vanje | 418.000 HIVE | @themonetaryfew | 3,946.507 HIVE |
| @gungunkrishu | 392.592 HIVE | @omonomo | 3,823.069 HIVE |
| @berien | 371.811 HIVE | @alexna | 2,726.390 HIVE |
| @deanliu | 360.000 HIVE | @revisesociology | 2,386.687 HIVE |
| @reseller | 251.999 HIVE | @technological | 2,192.765 HIVE |
This graph shows the daily HIVE power-up, power-down, and the resulting variation over the last 30 days. The table shows the topmost power-ups and power-downs of the day.

This graph shows the monthly HIVE power-up, power-down and the resulting variation.
Values for the last 3 months
| Period | Powerup | Powerdown | Difference |
|---|---|---|---|
| 2021-10 | 356,311.000 | 1,505,158.000 | -1,148,847.000 |
| 2021-09 | 4,552,777.000 | 2,892,984.000 | 1,659,793.000 |
| 2021-08 | 3,212,814.000 | 3,144,598.000 | 68,216.000 |
7. Transfers
These graphs show the volume (in USD) of HIVE and HBD transferred between accounts.
8. Exchanges
 |  |
These graphs show the amount and distribution of HIVE and HBD stored on the exchanges where they are listed.
 |  |
These graphs show the daily evolution of HIVE and HBD stored on the exchanges where they are listed.
I hope you find those stats useful. If you would like to see additional stats, feel free to drop me a comment. Your feedback is than welcome.
Thanks for reading.
Check out my apps and services


So proud to get a mention for the top PowerUp users.
Nice!
Hehe can't wait to see you again on the list 😅
Congratulations @arcange! You have completed the following achievement on the Hive blockchain and have been rewarded with new badge(s) :
Your next target is to reach 440000 upvotes.
You can view your badges on your board and compare yourself to others in the Ranking
If you no longer want to receive notifications, reply to this comment with the word
STOPVery nice and easy to read , thanks
Thank you @opidia
There is much more power down than power up for October.
And of course the selling. This is why Hive is not staying above $1 USD for long. People start a massive selling as soon as the price moves up a little bit, and they push (and keep) down the price with it. Hive is greatly undervalued nowadays. It should be much above $10 USD.
All benefit for those who buy the DIP and HODL... Looking forward to seeing HIVE at $10 🤑
Lots of nice graphs from which to understand how many people are saving HBD and how much they are saving. And you have explained everything beautifully.
Thank you @kawsar8035. Glad you find it helpful.
!PIZZA
!BEER
PIZZA Holders sent $PIZZA tips in this post's comments:
@eii(10/10) tipped @arcange (x1)
Learn more at https://hive.pizza.
Thank you! I always enjoy being tagged in these.
Always nice to see you making the list 😁