Off Grid Solar Power observations and challenges in the north
Yes, I'm a geek and I love keeping track of stuff, which is turning out to be very helpful for you. In this latest installment, I'll share the actual data that I collected off our solar system over a span of four years so that people can 'see' what it is like living with the wild fluctuations of power availability and how to manage it all.
In our part of the world, the weather is very unpredictable, but there are trends that we have noticed. Starting in October and running through to January, it gets very cloudy here, which has a significant impact on solar power production.
We also have a huge swing in solar availability due to the position of the sun. During Summer solstice (June 21), we will receive over 17 hours of daylight and 5 hours of twilight. Did you know that from May 14 to July 30, we don't experience night time conditions? During Winter solstice (December 21), we receive less than 7 1/2 hours of sunlight, 4 1/2 hours of twilight and over 12 hours of night time.
For the purposes of this post, twilight does not serve us at all as there is not enough solar energy hitting the panels to produce any power. For our calculations, we look at the sunlight hours, cloud cover, weather and air pollution. Yes, the geoengineering and other contaminates have a significant impact on how much solar energy reaches our panels. When it rains or snows, the moisture between us and the sun can reduce solar gain by over 95%. A cloudy day usually results in a 30-60% reduction. A hazy day due to pollution and other contaminants ranges from 40-75% reduction. The height of the sun during the winter is very low, resulting in solar rays having to travel through much more atmosphere compared to the summer. As a result, that can also reduce solar gain.
For all you fellow geeks out there, one fun reality living this far north is that the cold weather also results in increase efficiency in our panels. Our array is build with 12 - 125W panels, giving us a total rating of 1500W per hour at peek efficiency. However, when the panels are cold, I've witnessed our panels producing well over 2000W of power, which seems to only help during the spring when we have the sun to make that happen. However, during the summer when things get hot, our panels reduce in efficiency and will drop to about 1100W.
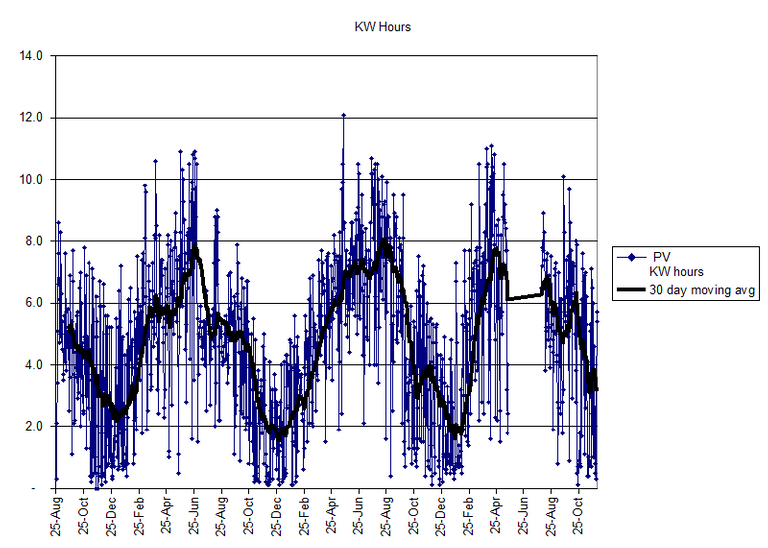
Due to the huge fluctuations that we experience here, our power generation swings wildly day to day, month to month. But over all, there is an ebb and flow that mirrors the seasons that Mother Earth goes through each year. This data runs from August 2007 to November 2010, with a small gap of data collection from April 2010 to Aug 2010.
The blue dots reflect the kilowatts that our solar system generated on the day. The black line is the 30 day moving average. As you can see, even during spring, summer and fall, the amount of power we get can fluctuate from over 10KW one day to less than 1KW the next. We worked hard to get our daily power consumption down to about 4KW per day. That means anything under 4KW we either have to draw from storage or generate using other means, like a gas/diesel generator.
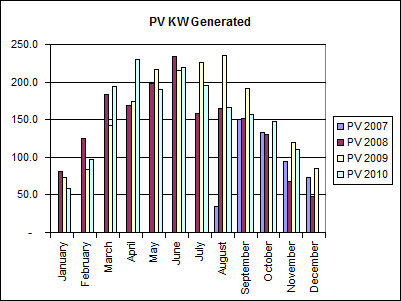
This graph shows the monthly data for each year to demonstrate that year to year our power generation changes. Note that the August 2007 number is low as that is when we turned on our system for the first time. If I was to average out these numbers, I come out with this graph, which may be easier for people to relate towards.
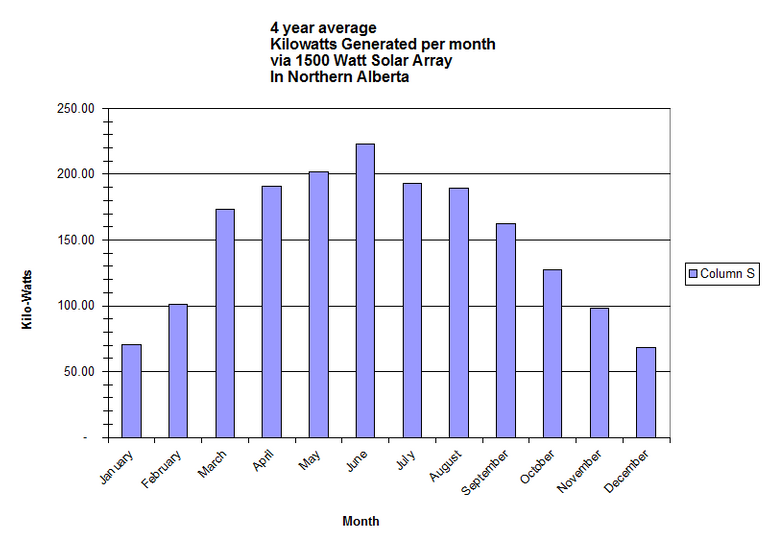
Using this graph, we find that we come short of our 120KW per month usage in a few months. October is good, but when we get into November, December, January and February, we are short. During these months we augment with a generator and based on my calculations, the generator accounts for less than 15% of our total power usage. That means the solar panels generate over 85% of our power.
I should note that we move our solar panels as the sun's position shifts through the seasons. From the first week of November to the first week of February, our solar panels sit about 10 degrees from vertical in order to maximize the solar gain from a low winter sun. Remember, only 7 1/2 hours of sun light, so we want to catch as much of this sun as possible.
From the first week of February to first week of May AND the first week of August to the first week of November, our solar panels are set to 45 degrees. The spring and fall equinox means the sun is rising directly east and setting directly west. This angle helps us catch most of the solar energy, although mornings and evenings is less due to the low angels. Solar trackers would catch more sun, but they are big, expensive and not worth the money in my view.
From the first week of May to the first week of August, we lay our solar panels flat. Because the sun takes such a wide swinging arch across the sky during the summer, nearly 260 degrees, we would miss hours of sun light if they were standing up. So we lay them down to catch as much sun during the day as possible.

Solar panels set at 45 degrees for spring and fall equinox
Any power over and above the 4KW per day is used for building, running power saws, air compressors, drills and other tools. We work hard to take advantage of the excess power generation through the summer, otherwise it is wasted. We also run our deep freeze at this time and then turn it off in the winter as Mother Earth keeps our food cold. Winter time we conserve power as much as possible due to the shortage of sun light hours, low sun and cloud deck that interferes with solar generation.
I should also point out that we have multiple solar systems here. When my mother-in-law moved out here, we built her a home and installed her own system on it as well. Same principles apply for her.

When you are working on sizing solar systems, it is wise to keep these issues in mind so that you don't shoot yourself in the foot by building too big or too small. When we built, it was cheaper to significantly reduce our power consumption rather than building a solar array to meet it. When we lived in St. Albert, our power consumption was about 660KW per month. We are now down to 120KW per month which is an 82% reduction in power usage.
How we did that is another blog entry!
To listen to the audio version of this article click on the play image.

Brought to you by @tts. If you find it useful please consider upvoting this reply.