BITCOIN: Mental-Personal Lesson learnt for the future
Exactly one week ago I posted about the use of the "Open Interest" as an excellent indicator for trading, in particular for those that like to "play" with the Futures game.
I actually use this tool in a daily basis in order to build a trading decision with great success combined with Elliot Waves theory, S/R, MA, Patterns recognition and RSI.
It is funny how I envisaged the inminent fall of YFI due to an "Open Interest" divergence and, also days before, the rise of CARDANO due to an iHS pattern and an increasing "Open Interest"too...but, I have to admit that I was so focused on scalping/trading each and every crypto I saw with good Setup conditions in the low time-frames that I lost totally the bigger picture of BITCOIN versus its OPEN INTEREST on the daily Chart.
The EW count on BTC was telling that the 5th wave was on-going, yes, but who knew at that moment how high it would have climbed?
Extended 3rd and 5th waves are really very frequent on Crypto, specially in a Bull Market so, we try to forecast the end of those waves by using FIBONACCI projections, pattern projected targets or detecting known levels of resistance, but, what happens when the asset or crypto you trade is near or, even worse, beyond the previous ATH?
As I said, maybe the use of FIBO levels may help a litle but the most efficient is to find signals of market exhaution.
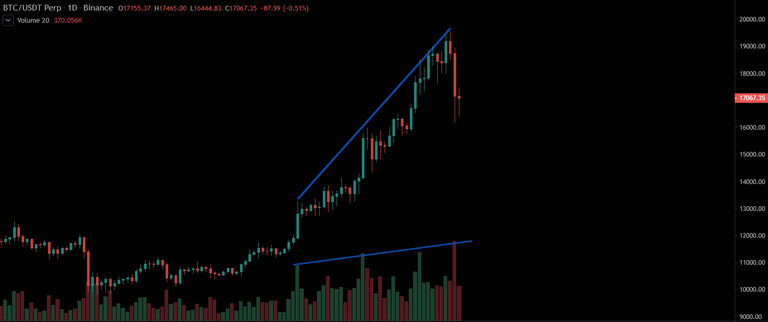
Volume is a good indication for sure, if you have a decrease on the trading volume it may indicate a lose of interest. However, the daily chart of BTC did not indicate us anything about the fall coming in terms of volume. No divergence, we passed from BULLS to BEARS
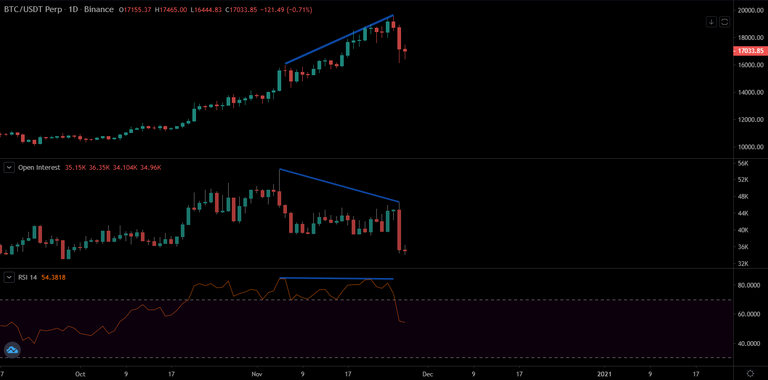
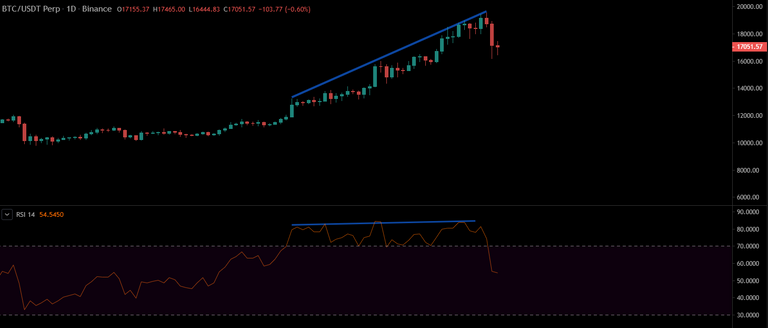
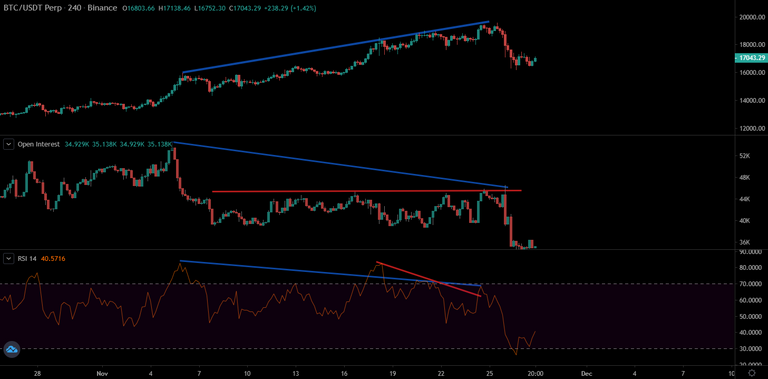
RSI is my preferred one in order to detect "DIVERGENCES", however on the daily this time the wasn't any one clear but an obvious "Overbought" condition for weeks, almos constant in the daily:
Then, we have the "Open Interest" with a clear Bearish Divergence:
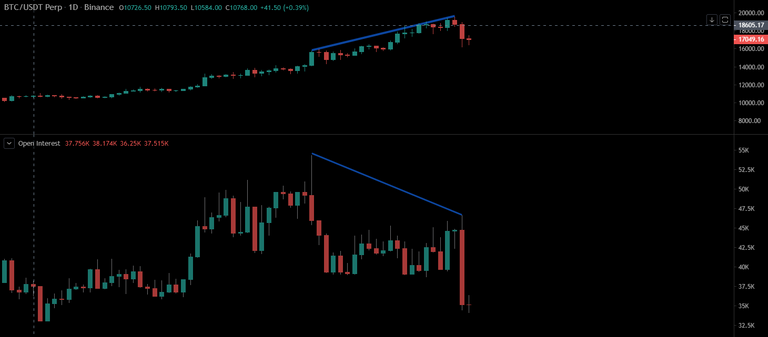
BITCOIN was in a clear decline of its open interest since it hitted 16000 USD but it reached 3000 USD more before falling abruptly.
To be more accurate sometimes is good to reduce the time-frame. On the 4h-chart the "DUMP" was more than announced:
- OPEN INTEREST FLAT (IN RED) despite the sustained price uptrend, no creation of new contracts.
- RSI (in RED) increasing the divergence in front of the price = BEARISH
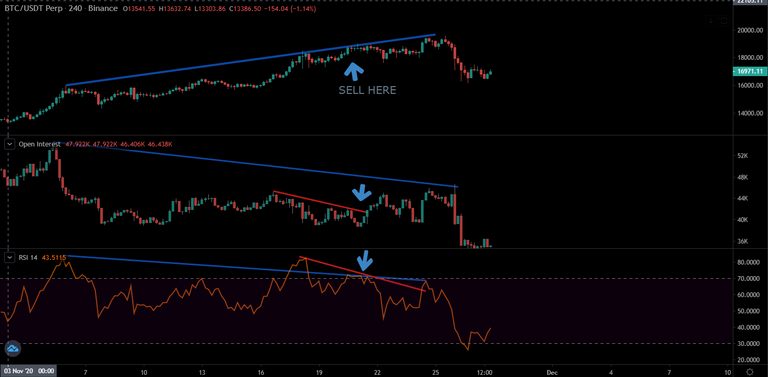
Yep, it looks like both indicators were really warning about the arrival of the fall just a couple of days before...
Mental-Personal Lesson learnt for the future:
Close the long positions on any crypto where both indicators diverge from price on the BITCOIN chart, don't scalp/day-trade for a while and resume when the market defines the new trend...
*Disclaimer: This is just my personal point of view, please, do your own assessment and act consequently. Neither this post nor myself is responsible of any of your profit/losses obtained as a result of this information.


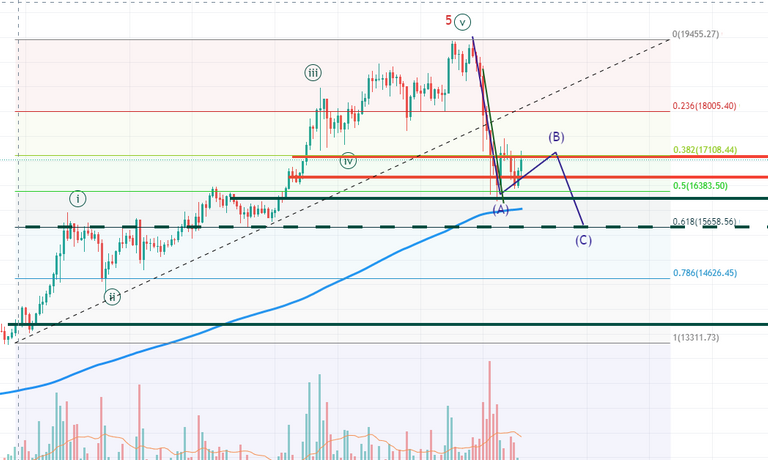
I had part of my BTC stash ready to sell.. and then this shit happened. Are we going to see 19k again, what's the crystal bal... er lines say?
😄 Well, I think we have still another leg down, 15650 USD might be a good support.
Let's see if you are right, I will hold (just part of my stash on Coinbase).
I always hold BTC, it is like my LONG TERM wallet anyway, but its chart helps me to trade other altcoins.
Definitely. Quite sooner than most imagine. I don't have any TA to back that up, but I do appreciate Eddie's one. He's also one of the few that write about their mistakes and learned lessons.
Great post by the way.
Posted Using LeoFinance Beta
Thank you for the analyse!
I'm a little more pessimistic and put a buy order at 14k as I see you are at 15,65k
That is so true! People are to greedy and will not follow this, which will bring the one who trade now, massive loses.
Posted Using LeoFinance Beta
Yo por si te sirve para probar/experimentar, en lo que mas he incidido durante esta escalada ha sido en buscar inicios de ondas (3) en diferentes rangos, para ademas de por su puesto medir la (3) ver donde podia acabar y si se pasaba de frenada con el 1,618% del tamaño de la onda (1), para medir retroceso de ondas (4) y ver si rebotaba en el 23,6%. Esto lo he encontrado con bastante facilidad porque se ha dado de una forma constante. Yo al ver eso, voy mentalizado que sige la sucesion de extendidas.
Por otro lado y por lo que tengo entendido, si se pasa de "freanada" en el 161,8% no pas nada, pero otra cosa es que la 3 alcance el nivel 261,8% de (1) sin una de esas correcciones del 23,6%.
No se cuantas he visto clavarla en la misma linea, lo que claro... daba mas seguridad.
Y ahora se o mas bien creo, que bien le quda un empujon y ya porque desde 9825$ (BINANCE) hasta el maximo teniamos hasta hace horas, era el 261,8$ del cabezon de Bart que la probe como 1 y vaya clavaba ese 261,8 que apenas rebaso antes dde caer 3000$.
al fianl me he enrollado.. la clave es el 23,6% o vaya, a mi me funciono en esta ocasion 😃
Tambien encontre muchas correcciones, que (C) no iba mas alla del 0.618 de (A) Y.... puede estemos ahora mismo, ante todo el rollo acabo contar...
1H
5min
El obj. 0.618% para (C) queda justo clavado sobre la roja es el 23,6% retroceso.
a ver en que queda eso...
y... VAYA!! Estba metiendo la pata. Aunque para explcar la idea vale el grafico, este esta mal, ya que la (3) se extendio hasta el 261,8%
Asi que me da que de 23.000$ no, pero buen, segun donde quede la 4 queda un rango para sacar un ultimo zasca!!
A no ser... todo eso se quede como la onda (1) de una ultima 5 🤣🤣🤣🤣🤣🤣🤣🤣