Crypto Analysis | BTC and STEEM entering a bigger correction?
Good day Steemians!
Join me in analyzing the crypto markets!
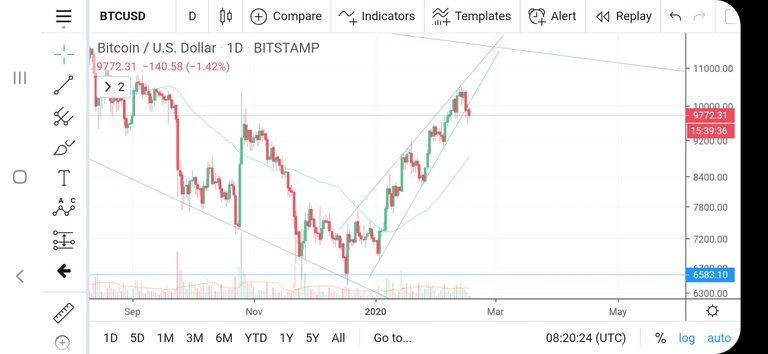
Some days ago I made a post which talked about the possibility of a major correction in BTCUSD. An upward wedge movement with only low volume point to a correction which could take us back to a price level below 8,000$ as low as 5,600$. This has been a long term prediction from several months back which might turn out (as it so often does) to have been much further in the future than anticipated.
This is the wedge pattern from the beginning of this year. Price never continues to the end of a wedge. A breakout to the top or bottom always happens much earlier. Due to a lack of volume it seems more likely that price will move downward.
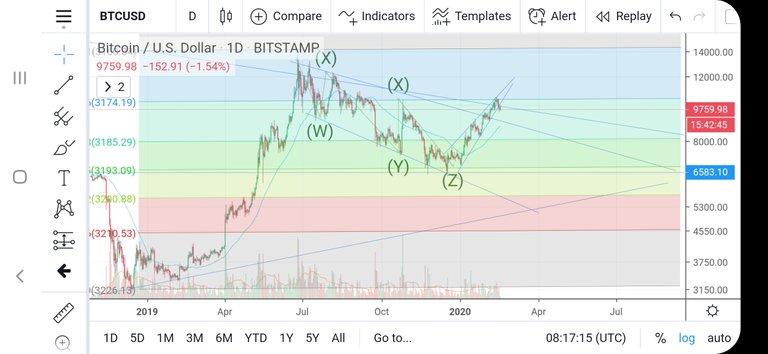
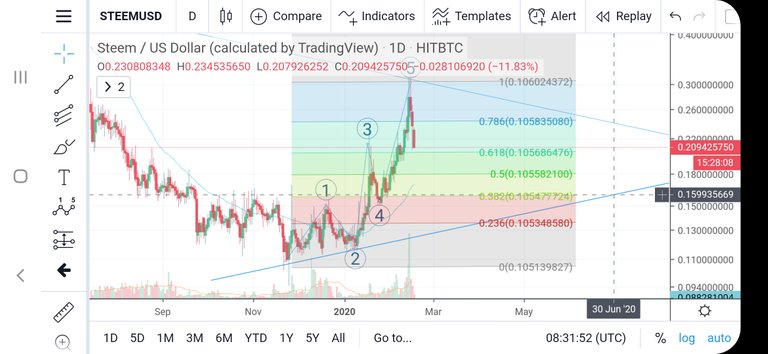
However another factor we identified in past posts is the reoccurrence of patterns which indicate that this pairing often corrects to the .328 fibonacci ratio. As you can see this would also quite nicely converge with the bottom support line seen in the chart as well as the month of may which will probably when the halving of BTC will occur.
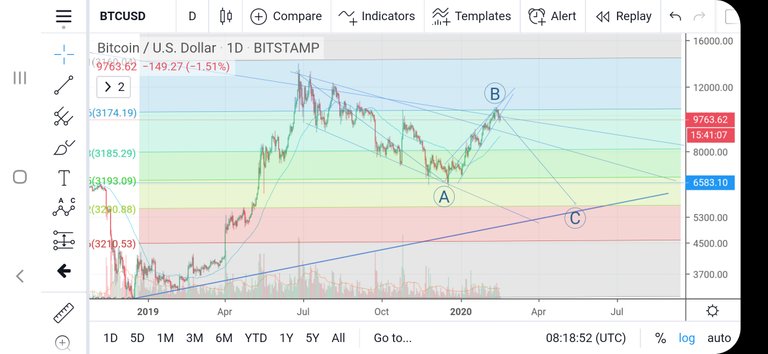
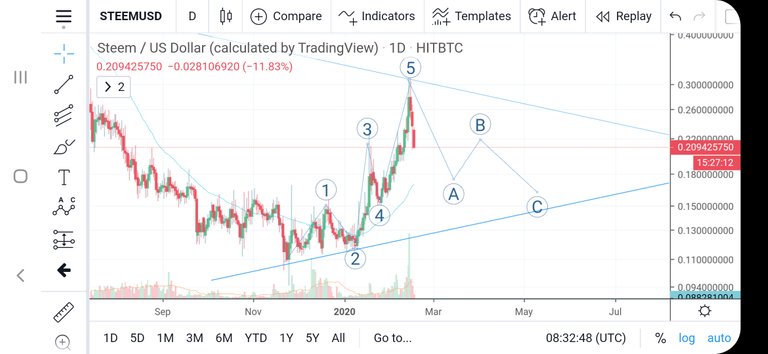
Additionally, this would also fulfill the Elliott wave correction of ABC as seen in the chart.
what will happen when BTC makes a correction? Generally all altcoins follow...
In other words the bullish market movement of STEEM will come to a temporary end (it already seems to have ended a couple of days ago).
In this chart you can see the impulse wave with the 5 waves quite well:
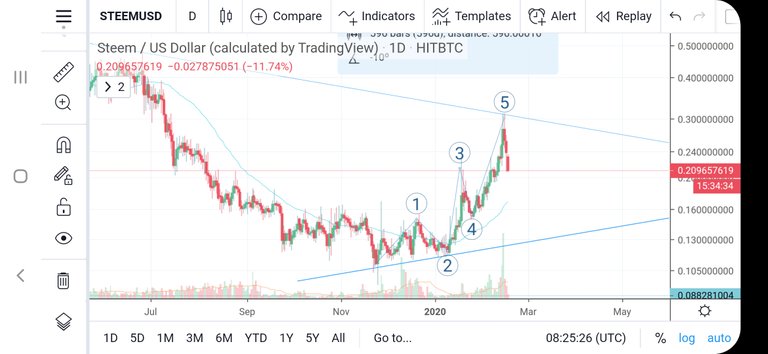
STEEM has tripled in price in only some weeks. This is a good sign that the rise in price will reverse and make a correction. However, the main indicator here is the correction in BTCUSD which will translate to this coin as well.
Of course the question now is how much of a correction we will see. Using the fibonacci ratios here as well I think we could very well see prices as low as 16 cents, before perhaps entering the next impulse wave. This might be the last time we will see prices come so low.
The next chart is a very rough scenario how things could develop: prices drop to around 18 cents only to rebound to about 20 cents. Another correction takes prices to about 16 cents. This also converges once again quite well with the bottom support line.
As a general reminder: Please keep in mind that none of this is official investment advice! Crypto trading entails a great deal of risk; never spend money that you can't afford to lose!
Doubt it, think it was just a weekend fakeout! lol Back to Da Moon for STEEM & BTC!! My BTC Bear post was just a joke! You never know though, anything is possible!
Well see ;) long term is definitely up
Just a quick note about your counts.
Some theory about Impulse Waves.
I think all of that applies here? Do you have better suggestion? :)
At least stick to the rules and give a warning that you do not know the EW theory. This is just your free interpretation of it.
I actually studied EW theory quite a bit and have found that a dogmatic interpretation of it often does not work. It's not a law of nature ... it's a human idea of how things might work.
I agree - it can not work if you ignore even the basic rules. 😉
Bumping for more views
@tipu curate
Upvoted 👌 (Mana: 15/20 - need recharge?)