The Degen Daytrading Diaries: Bitcoin Entering a Re-Accumulation Range During Wyckoff Distribution
I've finally branded this quasi-normal trading series which acts as filler between my creative stuff. Welcome to the Degen Daytrading Diaries.
If you missed my regular Friday night show yesterday (Joculation) which is hosted on MSP Waves, I shared my recent experience on Tradingview where I received a warning from the Moderator of Tradingview in the troll box because apparently my troll game is A+. It seems someone was a bit too butthurt from being trolled, and I forgot to offer a Kleenex and a warm hug to help bring them back to their happy place. Moral of the story is no more full contact trolling for LP anymore in Tradingview trollbox because it's a touchbutt trolling only league. It's all good and life goes on.
Now onto the trading analysis....
My hope is most were positioned in a short for that drop to the $8,800, got a chance to cover and move into a long to enjoy some of the bounce once the bottom of the new TR was established.
The 4H Intraday Chart
Looking at the Intraday Chart, supply came into the market and pushed the price of BTC to a low of $9,300 before recovering to the $9,600 level and subsequently falling to the $8,800 level signaling a new re-accumulation range for the 4H Intraday.
Before dissecting this a bit, let me be clear – on the macro level (higher time frames) we are decidedly still in the beginning stages of a Wyckoff Distribution seeking the lower end of the TR at $8,120. However, the Intraday is signaling a Wyckoff Re-Accumulation phase is underway. Think of this as the pause at the gas station for fuel and snacks before the larger Distribution continues.
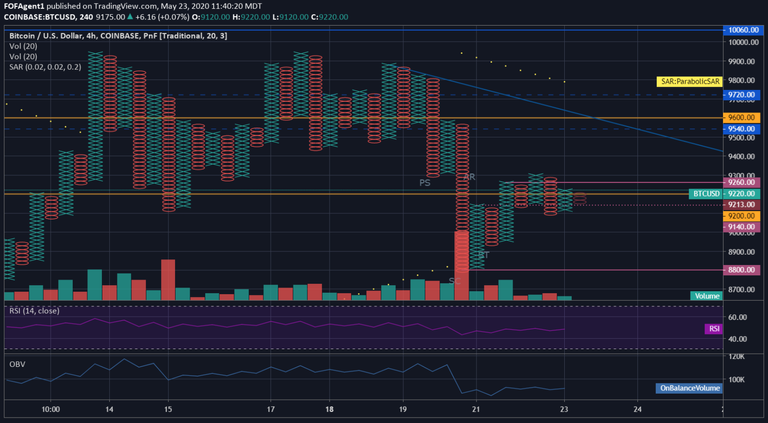
The first drop to the $9,300 level established Preliminary Support (PS). The subsequent drop to $8,800 on a Selling Climax (SC) established the lower end of this trade range, and the Automatic Reaction (AR) pushed the price upward to $9,140, which established the initial upper end of the trade range during this re-accumulation phase.
After performing a Secondary Test (ST), the price pushed past the initial upper boundary of the trade range (as expected in Wyckoff Accumulation) and established a new upper end of the trade range at $9,260. Shortly after, the formation signaled a Sign of Strength (SOS) as the price pushed past the newly established upper end of the trade range (at $9,260) to $9,300 before falling back to $9,140 and advancing again. It seems after the Sign of Strength, the upper book ends at $9,140 and $9,260 are acting as support and resistance, suggesting entry into Phase D of the Wyckoff Re-Accumulation Phase, with a target price of $9,640.
This would make sense because the upper trendline of the formation which started this larger Wyckoff Distribution is around the $9,640 range and would effectively re-establish Demand in this zone for the larger Wyckoff Distribution continue.
The 1D Chart
Looking at the 1D chart, we can see the PA has pushed the price above the psychologically significant $9,200 range and no significant resistance is reflected until at least the $9,600 level.
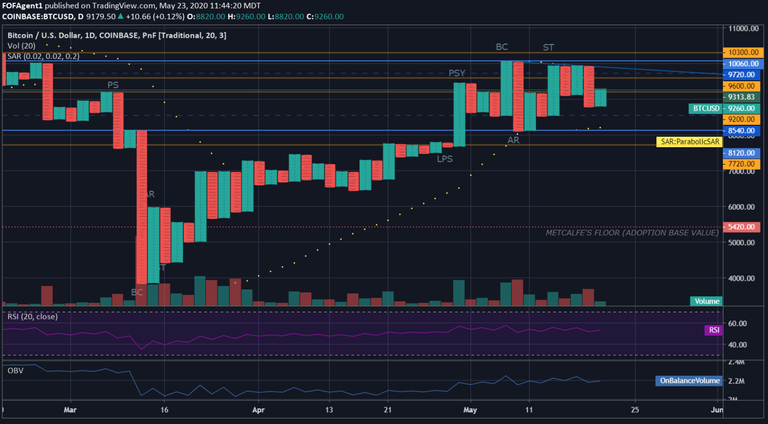
For the formation to flip bullish on the 1D, the PA would have to advance to the $9,940 level to signal a double top (which is bullish in Point and Figure), advance further to the $9,960 level to signal a buy, and break the $9,980 level to confirm.
Despite the Wyckoff re-Accumulation range reflected on the 4H Intraday, this scenario (from my perspective) is highly unlikely at this time. While I expect the upper end of the TR to eventually have a final Upward Thrust to the $10,300 level, the current scenario I see in the near term is a move to $9,600 - $9,640 range before resuming the Wyckoff Distribution down to the lower end of the TR ($8,120).
Always remember this is not trading advice.
Outside of that, Happy Trading.
You can follow me and keep up to date on Tradingview as well. I trade under the handle FOFAgent1 at tradingview.com