The Degen Daytrading Diaries: Bitcoin Consolidation Continues in a Second Wyckoff Re-Distribution Phase
Hopefully, everyone managed to have a great Memorial Day yesterday filled with a little bit of the normal we are all looking forward to returning.
The 4H Intraday Chart
Looking at the Intraday Chart, the formation appears to remain solidly within a second Wyckoff Redistribution. After the Selling Climax (SC) at $8,640 established the floor of the Redistribution trade range, the Automatic Reaction (AR) turned north to $8,860 and established a prelim upper end of the trade range for this Redistribution phase. The formation turned downward again and performed a successful Secondary Test (ST) of lower end of the trade range at $8,680 before turning north again to signal a double top (a bullish signal in Point and Figure) at $8,860. The formation continued to push past the double top to signal a buy at $8,880 and confirm the buy signal at $8,900 before pushing higher and stalling out at $8,960 to establish the upper end of the new trade range at. The lower end of the new trade range would be the prior high at $8,860.
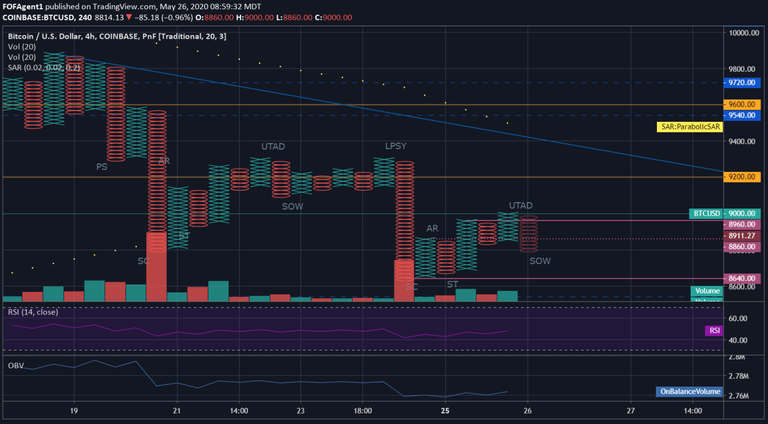
Given we are in a Wyckoff Distribution phase which has yet to retest the lower end of the 1D (higher time frame) trade range, and the 4H Intraday trade range just exited a recent Redistribution phase, this confirmation to buy signaled at $8,900 would appear to be a false buy signal.
Immediately after establishing the upper end of the new trade range at $8,960, the formation turned lower and broke through the lower end of the new trade range at $8,860, as the PA pushed down to $8,840 in a failed test of the trade range. The formation turned higher again, and pushed past the upper end of the trade range at $8,960 forming a double top (a bullish signal in Point and Figure), signaled a buy at $$8,980 and confirmed the buy signal at $9,000 on a perceived Sign of Strength (SOS). Again, the PA stalled after the buy signal was confirmed, the formation turned lower again, and broke through the lower end of the trade range a second time. It formed a double bottom at $8,840 (a bearish signal in Point and Figure), signaled a sell at $8,820, and confirmed the sell signal at $8,800. Given back to back Signs of Weakness (SOS), I would expect the high of $9,000 is an Upward Thrust After Distribution (UTAD) rather than a Sign of Strength (SOS).
Currently, the formation has only $360 of cause built in from the consolidation in this second Redistribution range, which is insufficient to establish a decisive move in either direction. My expectation is this redistribution should play out in a similar manner as the prior Redistribution consolidation range, with almost as many candles in the horizontal congestion count before a move downward. The first Redistribution level had a horizontal count of 14 candles before sufficient cause was built up for a move down. The current Redistribution level has 6, so I would imagine we may remain here for another day or two before the next move.
The 1D Chart
Looking at the 1D chart, after the PA flipped to a green candle, it pushed higher before stalling out at $9,000. The current price of BTC is $8,843 as of this writing and, unless the daily closes out above $8,840 (preventing a reversal), the formation will print a lower high on the 1D.
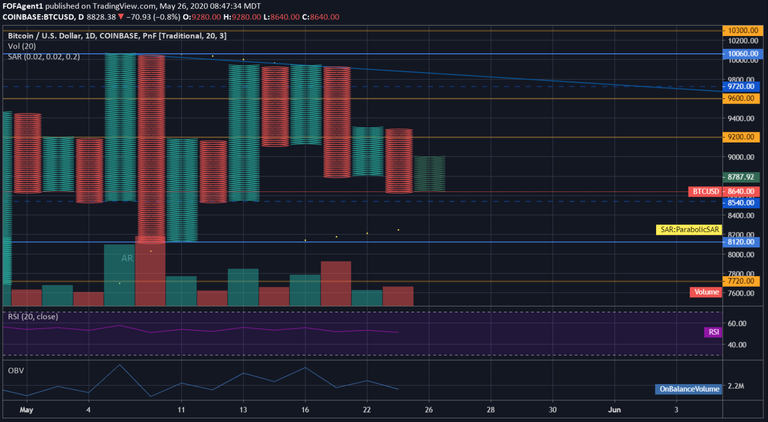
My expectation is for the formation to print a lower high over the next few days. The formation still has a ton of room to run (up to $9,280) and can still print a lower high, although I see it as very unlikely while the PA is so strictly confined on the Intraday and signaling Signs of Weakness (SOW).
Always remember this is not trading advice.
Outside of that, Happy Trading.