Markets turn RED! Bitcoin Technical Analysis for February 16
Bitcoin Technical Analysis 2-16-2020
Yesterday we saw a bit of a dip in the Bitcoin price which means a dip in the crypto market as a whole as well.
Queue up the rekt and doomer boys as per usual.
But, it’s nothing to be worried about at all. We are still well within key support areas of the current uptrend and this could be a healthy small pull back.
Bitcoin 4 Hour Chart
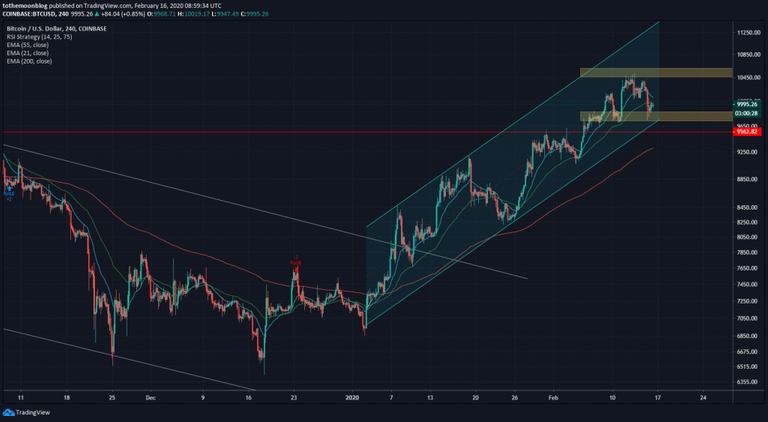
Taking a look at the 4 hour chart, you can see that Bitcoin is still trading pretty well within this upward trend.
The yellow boxes on this chart indicate some key areas of support and resistance. You can see we have been trading in this region for a few days now.
Should we break the yellow box to the downside, our next support would most likely be the red line/$9500 range which is a historical support. If this happens, then we can definitely start looking for a bigger correction downwards. But, until then, the trend is your friend and I’m still holding a bullish bias.
Bitcoin Daily Chart
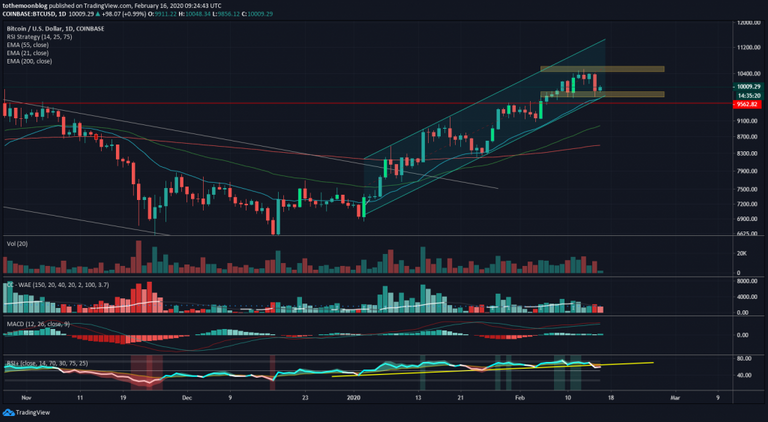
Here on our daily we can see much of the same as the 4 hour. We are still within our trend channel and within the key areas of support and resistance.
Moving averages are still looking bullish. The price of Bitcoin is still sitting pretty well above the 21 day EMA.
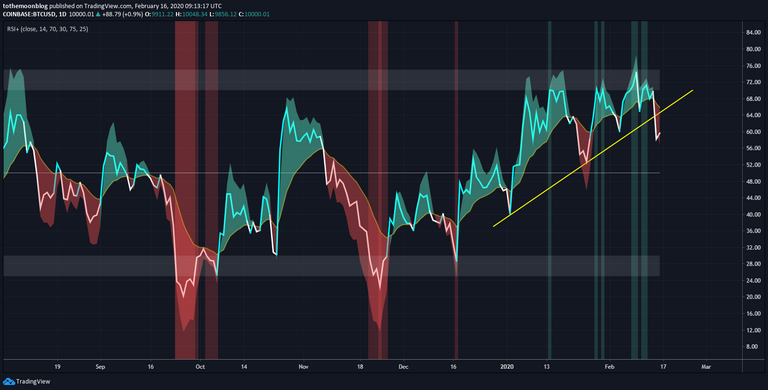
MACD momentum is starting to dwindle a bit. The RSI has also broken its uptrend support line with a small cut to the downside. I have included an image of the RSI below to make it more clear since it is hard to see in the above chart.
The RSI is turning back up and we are working with a small green candle to start the day. Again, I don’t see anything here to worry about just yet and my outlook is still bullish.
What's next?
I’m expecting Bitcoin to trade in that money zone of $9900-$10,500 possibly all weekend.
I would expect our next bigger move to come at the beginning of the week when markets and CMEs open up. They will be closed on Monday though if I’m not mistaken.
As for those next moves, if we can break that $10,500-$10,600 range, I would expect our next resistance to be $10,900 or $11,000. If we were to break to the downside for some reason, $9,500 would be the zone to watch. If we close below $9,500 we could easily end up in the $8,800-$9,100 range.
Thank you!
Thanks for reading! Be sure to check out the To The Moon telegram group and don't forget to claim your 35% deposit bonus promocode on ALL deposits until April 1, 2020. This is a special promotion for our readers only! Click the banner below for more information. We also have videos coming VERY soon!

Original post from my blog: https://tothemoon.blog/trading/technical-analysis/bitcoin-technical-analysis-for-february-16-2020/
@coininstant come back to TTM brother!
Posted via Steemleo
$trdo !DERANGED !COFFEEA
Congratulations @contrabot, you successfuly trended the post shared by @treepi!
@treepi will receive 0.95477738 TRDO & @contrabot will get 0.63651825 TRDO curation in 3 Days from Post Created Date!
"Call TRDO, Your Comment Worth Something!"
To view or trade TRDO go to steem-engine.com
Join TRDO Discord Channel or Join TRDO Web Site
ESTM Boosting refund to @treepi!
Due to one of these reasons:
1. Not posted from eSteem apps.
2. Already curated by eSteem team.
3. Need bit more improvement on quality of post.
4. Might be too old post.
5. User already received vote in last couple hours, you can try boosting again afterwhile.
Android, iOS, Windows, Mac, Linux
Learn more: https://esteem.app
Join our discord: https://discord.me/esteem
What, get rekked! It is going damp!!! lol I’m shorting!!! lol For real, it is bad news not mewn bears! 🐻🐻🐻🐻🐻🐻🐻🐻🐻🐻🐻🐻🐻🐻 There’s no support out there, all there is, is free fall!!!! I just did a post about it! BTC to 9k, maybe 7.5k, but serious this time!!!!!! I still upboated u cause u will need every penny if it after this latest liquidation damp sets in!
To me it looks like we’re about to fall out of that huge rising wedge channel!!
Falling hard!!!!!!! Big drops coming tonight, should see 93-94 soon! Initially i thought it was just another weekend fakeout, but then i took a good hard look at the charts and realized the truth!
Yeah that orange box region looks like a bear pennant!
Good luck with that longing!!!!
Congratulations @treepi, your post successfully recieved 0.95477738 TRDO from below listed TRENDO callers:
To view or trade TRDO go to steem-engine.com
Join TRDO Discord Channel or Join TRDO Web Site