The Technical Analysis Glossary of Terms
I'm starting to enjoy this posts that stem from a request or question from one of my readers.
Many read my technical analysis posts but don't always understand the terms being used - so let's cover many I use and even some I don't so that everyone can understand what all the techno babble is about.
Glossary of Basic Terms
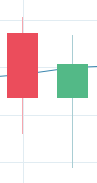
Candle Stick: Shows the open, close, high and low price for a given time period. The body of the candle represent the difference in open and closing price, while the upper and lower wicks mark the high and low for the period.
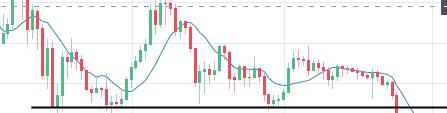
Support/Resistance Line: A price area that represents price stopping or reversing two or more times.
Falling Knife: A term referring to the attempt to buy the bottom of an asset that is consistently falling in price.
Ascending Triangle: A chart pattern where higher lows are being made while price fails to make new highs.

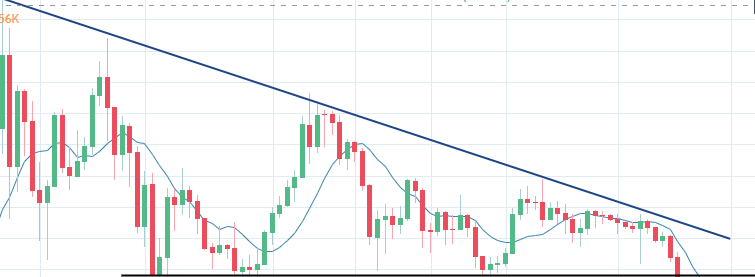
Descending Triangle: A chart pattern where lower highs are being made but price does not make new low prices.
Moving Average: The average of the closing price of a coin over a specified period of time.
Those are just a handful of the commonly used terms in technical analysis posts. There are plenty more, but these basics will get you started.
Advanced indicators like bollinger bands, fibanocci levels and RSI are all defined from price and moving average data so understanding the basics is the key.
More detailed lessons
You can watch videos I made on:
- Spotting support/resistance levels
- Recognizing Bullish U-turn patterns
- Using multiple time frame analysis
On my scaredycatguide website. The video course is free to view for the time being, but that won't last!
Thank you for posting from the https://steemleo.com interface 🦁
@metzli hopefully the above info helps ;-)
Great post! Thank you for taking the time to explain some of these to me.
I can most def “see” ascending triangles and descending triangles, not so confusing after all.
Catching the falling knife is interesting.
But, it is only thanks to people who try, that the knife stops.
That said, there are two places to enter.
When the value is worth well more than the price (IBM a long while ago)
or
When the bottom has already been reached, has made some recovery, and the overall pattern is bullish.
The problem is, there really is no support.
There really is no stock market.
And a pullback looks just like a market crash.
Yep, alot of truth in those statements. All I can do is wait for a high volume reversal and hope we then put in a higher low. Those are the bottoms I then try to buy.
Maybe a little too in depth for this type of post, but I would be interested in the triangles if and when you use the body or the wick of the candle to draw the lines.
One thing I've never really understood is if there is a rule of thumb for which to use when or is it mostly personal preference?
The thing about technical analysis is it is just as much a science as it is an art. To answer your question, I would say both.
Sometime if have a good high or low to start a trendline off of then I will use it, otherwise I try to draw of the main point of each top of bottom with the line hitting some wicks and some closing prices along the way.
You can sort of see what I am talking about in the descending triangle example above.
This holds true with support and resistance lines as well. It's not the exact price where the line is but the area of it we expect price to have something happen.
If you are free at 4pm EDT time on Tuesday's I do the scaredycat investor show on MSPWaves and do a crypto charting segment each show.