Looking at the Bitcoin Price Chart Over a Two Year Span Things Look Like They Want To.....
Make your assumption first before I tell you mine! The chart below seems to be repeating moves of the past just on a more muted scale.
So what's that mean???
It means that when I look at this chart every ounce of my instincts from years of investing says we are going down to 6K. I certainly hope I am wrong because I need this mofo to start going up again yesterday!
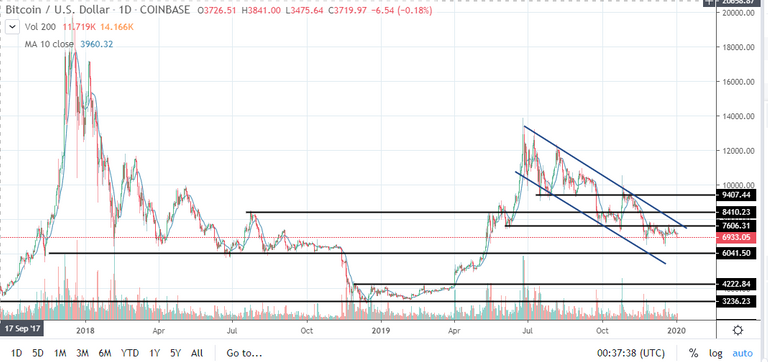
Though, looking at the price action more there is a possibility that this mid-six thousand area price is in now is a bottom building out. I sure hope so.

0
0
0.000
Since future trading starting the price manipulation in the price of btc is now epic
Yeah, no arguments here!
It's not manipulating. It's bot trading.
I haven't gotten back into btc yet. I have been accumulating liquid steem in order to buy back in so if it goes down better for me I suppose. However, I'm addicted to steem so I don't know if I will ever pull the trigger.
I'm doing the same.