ChainLink (LINK) Price Searching for Support Following the Rip
Chainlink had a nice move the begin October, ripping to nearly $3 a coin before running out of gas. A pullback is digesting some of that move now, but where will that stop.
Prior tops are potential support
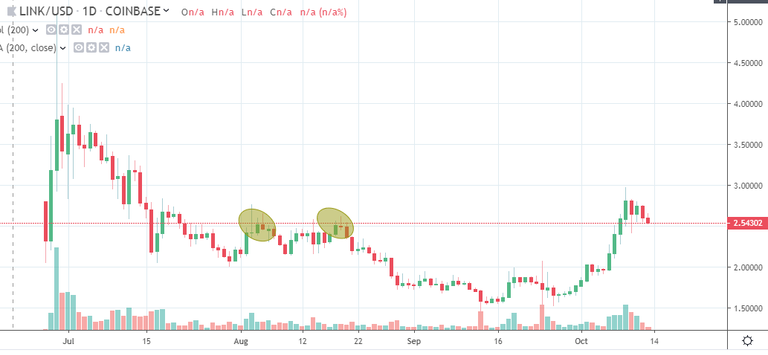
Looking at the chart the current price line (dotted red) almost looks like a support/resistance line.
You can see to the left the two prior tops highlighted in gold. The $2.50 area clearly has some history as a pivot point, acting as resistance in the past, which means it now becomes potential support with price breaking through it on the up move.
I'm keeping an eye on the price action at this current level and would like to see a confirmation of it, such as a reversal candle that triggers a long entry. The upside target would be that last high just shy of $3.
If $2.50 isn't going to be the support then the next downside level is $2.05 area.
Thank you for posting from the https://steemleo.com interface 🦁
Nice looking chart, yeah lets see if that $2.50 holds. Your next target on the downside is my daily demand level.
Was wondering about that. Is 2.50 a supply level for you then?