Publish0x: ETH Tipping Data Visualization (80/20)

On publish0x platform, you can change tipping % and this is the last visualization, 80% author and 20% me.
Publish0x is a Free ETH tipping blogging platform and I was hoping to find some interesting tipping strategy for doing this visualization.

- 20% to author / 80% to me (Result here)
- 50% to author / 50% to me (Result here)
- 80% to author / 20% to me (This post)
to see how ETH tipping value is going to be affected.(also BAT and LRC tokens)
80/20 is my default tipping % because I don't have to move the slider up and down.
It is just too much work me to slide this for each post I want to tip, and also I think if I like a post, author deserve get most of the tip. (and i want something for tipping 🤣)
But anyway, here is the data I collected for this post.
# 80/20
tipping_data = {
    '1': {
        'eth': [0.00003438, 0.00000871],
        'bat': [0.0139],
        'lrc': [0.0096, 0.0096, 0.0097, 0.0097]
    },
    '2': {
        'eth': [0.00001311, 0.00000655, 0.00000655, 0.00000648, 0.00000648],
        'bat': [0.0052],
        'lrc': [0.0297]
    },
    '3': {
        'eth': [0.00002987, 0.00001493, 0.00000747],
        'bat': [0.0062, 0.0061],
        'lrc': [0.0076, 0.0076, 0.]
    },
    '4': {
        'eth': [0.00003259, 0.00000827, 0.00000827],
        'bat': [0.0065],
        'lrc': [0.0185, 0.0094, 0.0092]
    },
    '5': {
        'eth': [0.00003269],
        'bat': [0.0127, 0.0063],
        'lrc': [0.0089, 0.0089, 0.0095, 0.0095]
    },
    '6': {
        'eth': [0.00003415, 0.00001708, 0.00000854, 0.00000850, 0.00000850, 0.00000809],
        'bat': [0.0066],
        'lrc': []
    },
    '7': {
        'eth': [0.00001641, 0.00000821, 0.0000809],
        'bat': [0.0063, 0.0063],
        'lrc': [0.0318, 0.0079]
    },
}
Feed this data into my python plotly script. Looks like this 👇
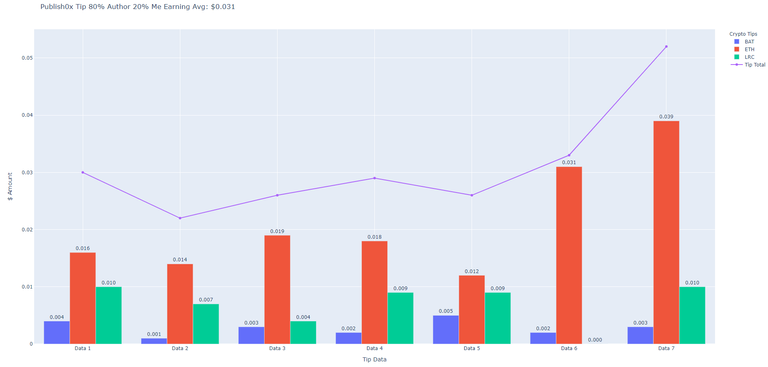
You can also see the graph here.
https://floating-meadow-28045.herokuapp.com/chart-80-20
https://tomoyan.github.io/chart-80-20
Tipping earning avg is about ~$0.03 a day.
This was the week that ETH and all the other coins went down so if it were up, the daily avg could have been more than $0.03, but still an improvement from $0.02 a day 😂 4 months ago.
Publish0x used to change payout coins depends on how you tip, how much you tip so that if you do 80/20, you would BAT more than other coins, or 20/80 you would get more LRC...etc and stuff.
But when Publish0x implemented ETH tipping, I guess they change the payout so that you will get more ETH than any other coins regardless of how you tip.
Damn, there is no tipping hack or trick that I could find 🤣
Maybe they will change this in the future... so I might try this again some time.
If you are interested in Publish0x
Join here 👇 You can use their payout to Power Up 😉
Here is the script for the chart.
from tip_data import tipping_data
import plotly.graph_objects as go
import requests
import statistics


def get_price(id):
    # Call coingecko API to get usd price
    base_url = 'https://api.coingecko.com/api/v3/simple/price'
    eth_url = '?ids=ethereum&vs_currencies=usd'
    bat_url = '?ids=basic-attention-token&vs_currencies=usd'
    lrc_url = '?ids=loopring&vs_currencies=usd'

    if id == 'ethereum':
        try:
            r = requests.get(base_url + eth_url, timeout=3)
            r.raise_for_status()
        except Exception as err:
            print("Exception Error:", err)
            return 0.0
    elif id == 'basic-attention-token':
        try:
            r = requests.get(base_url + bat_url, timeout=3)
            r.raise_for_status()
        except Exception as err:
            print("Exception Error:", err)
            return 0.0
    elif id == 'loopring':
        try:
            r = requests.get(base_url + lrc_url, timeout=3)
            r.raise_for_status()
        except Exception as err:
            print("Exception Error:", err)
            return 0.0
    else:
        return 0.0

    return r.json()[id]['usd']


def main():
    eth_price = get_price('ethereum')
    bat_price = get_price('basic-attention-token')
    lrc_price = get_price('loopring')

    eth_amount = 0.0
    bat_amout = 0.0
    lrc_amount = 0.0
    days = []
    eth_data = []
    bat_data = []
    lrc_data = []
    total_data = []

    for key in tipping_data:
        eth_amount = f"{sum(tipping_data[key]['eth']) * eth_price:.3f}"
        bat_amout = f"{sum(tipping_data[key]['bat']) * bat_price:.3f}"
        lrc_amount = f"{sum(tipping_data[key]['lrc']) * lrc_price:.3f}"

        days.append('Data ' + key)
        eth_data.append(eth_amount)
        bat_data.append(bat_amout)
        lrc_data.append(lrc_amount)
        tip_total = float(eth_amount) + float(bat_amout) + float(lrc_amount)
        total_data.append(tip_total)

    avg_total = f"${statistics.mean(total_data):.3f}"
    print(avg_total)

    eth_data = list(map(float, eth_data))
    avg_eth = f"${statistics.mean(eth_data):.3f}"
    print('AVG_ETH: ' + avg_eth)

    bat_data = list(map(float, bat_data))
    avg_bat = f"${statistics.mean(bat_data):.3f}"
    print('AVG_BAT: ' + avg_bat)

    lrc_data = list(map(float, lrc_data))
    avg_lrc = f"${statistics.mean(lrc_data):.3f}"
    print('AVG_LRC: ' + avg_lrc)

    # Daily tipping bar chart
    fig = go.Figure(data=[
        go.Bar(name='BAT', x=days, y=bat_data),
        go.Bar(name='ETH', x=days, y=eth_data),
        go.Bar(name='LRC', x=days, y=lrc_data)],
        layout_title_text=f"""
        Publish0x Tip 50% Author 50% Me Earning Avg: {avg_total}
        """
    )
    fig.update_traces(texttemplate='%{y:.3f}', textposition='outside')

    fig.add_trace(
        go.Scatter(
            name='Tip Total',
            x=days,
            y=total_data
        )
    )

    # Change the bar mode
    fig.update_layout(
        # barmode='stack',
        xaxis_title="Tip Data",
        yaxis_title="$ Amount",
        legend_title="Crypto Tips",
    )
    # fig.write_html('chart-20-80.html', auto_open=True)
    fig.write_html('chart-50-50.html', auto_open=True)
    fig.show()


if __name__ == '__main__':
    main()
Get Rewarded For Browsing! Are you Brave?


➡️ Website
Upvoted by GITPLAIT!
We have a curation trial on Hive.vote. you can earn a passive income by delegating to @gitplait
We share 80 % of the curation rewards with the delegators.
To delegate, use the links or adjust 10HIVE, 20HIVE, 50HIVE, 100HIVE, 200HIVE, 500HIVE, 1,000HIVE, 10,000HIVE, 100,000HIVE
Join the Community and chat with us on Discord let’s solve problems & build together.
Yay!
Your post has been boosted with Ecency Points. Keep up the good work!
Dear reader, Install Android: https://android.ecency.com, iOS: https://ios.ecency.com mobile app or desktop app for Windows, Mac, Linux: https://desktop.ecency.com
Learn more: https://ecency.com
Join our discord: https://discord.me/ecency
Nice data set. It's unfortunate that there is no trick this time. Who knows, maybe when they introduce another coin 😅
They should add BLURT next time lol
I approve 💯%.
This message is sponsored by the Blurt Gang
🤣 🤣 🤣