Technical Analysis of BAT/USD & possible scenario - 30/12/2019
BAT/USD is now trading at 0.198 and is looking bullish. This pair from last three days has been trading in the positive territory making higher high and higher low. The candle stick pattern is also suggesting that at least in the short to medium term the pair may trade bullish.
In the candle stick pattern of the 1D chart, we can see the follow-through candles and already three bullish candles have been formed. Most importantly the daily close is above the previous candle, suggesting bullish sign for this pair.
So let's get into the technical part of this pair. We will analyze it on the basis of moving averages and also we will apply trend indicators for clarity on the direction of this pair.
Moving Average
We will plot SMA(Simple Moving Average) 5, 10, 20, 50, 100, 200 SMA.
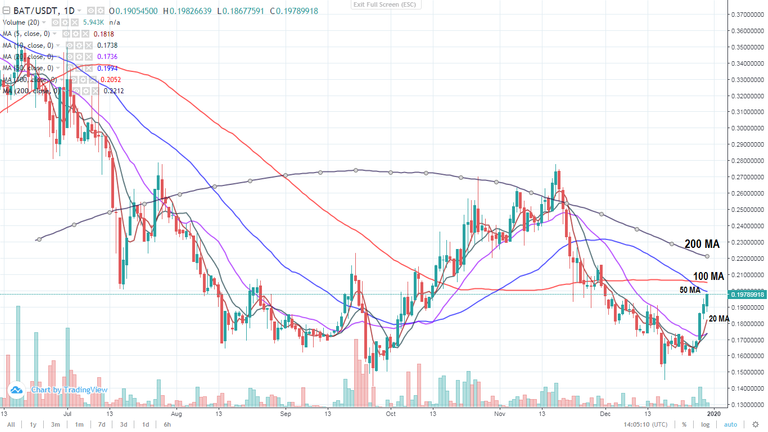
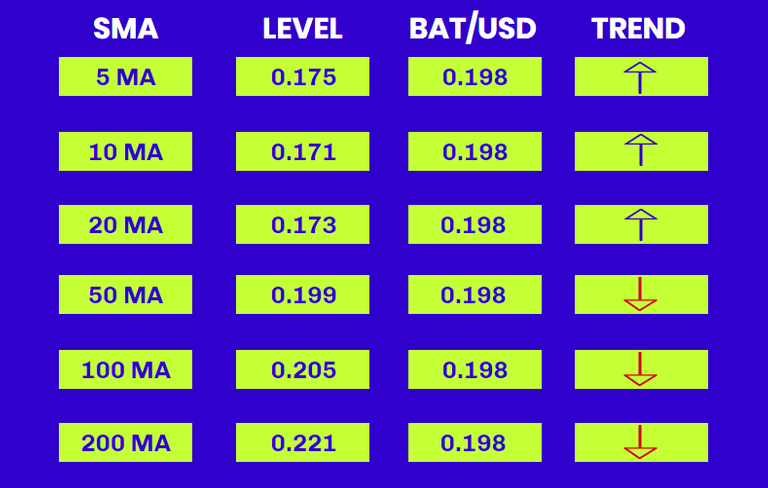
As evident from the graph, the price of BAT/USD is now trading at 0.198 which is just below 50 MA level. The price is already trading above 5,10, 20 MA and it is right now approaching 50 MA. So the immediate resistance for this pair will be 50MA, followed by 100 MA and 200 MA. The 50 MA level is 0.199, 100 MA level is 0.205 and 200 MA level is 0.221. That means BAT/USD will face immediate resistance at 0.199 followed by 0.205 and 0.221 in the short term.
MACD & RSI
MACD (12,26,9) has already turned positive for 1D chart of BAT/USD and the 12 period EMA is well above the 26 period EMA and both are getting wider suggesting that positive momentum is building in the 1D chart, so further gain is on the cards for BAT/USD pair. The histogram has started plotting above the baseline of MACD, so again the bullish momentum is building up for this pair.
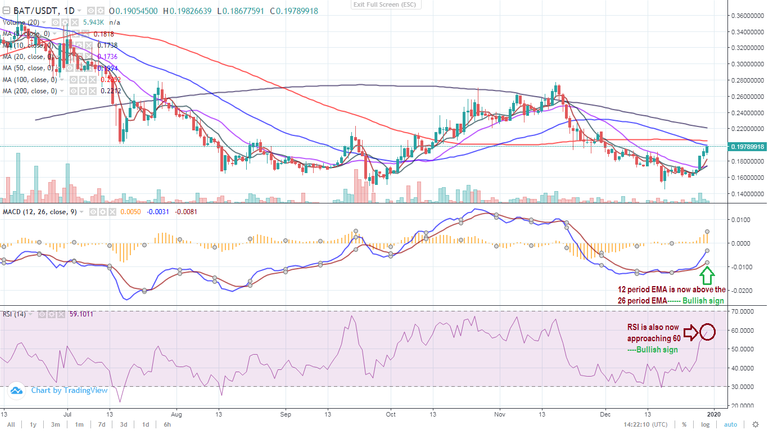
RSI(14) is also showing bullish sign as it is now approaching 60 and it is suggesting upward momentum for this pair. If in the coming days RSI will be able to stay in this range and keep its reading in the range of 60 and above then it would get further bullish for BAT/USD. The sustainable reading of RSI in the upward zone of 50 to 70 will be a potentially bullish sign for BAT/USD.

What could be the possible chart formation from here on!
If you look at the larger time frame of BAT/USD chart, then it clearly shows that the level of 0.145 is very well respected in the past and that also aligns with the trend line support. Below 0.145 level, 0.010 has always been the second major support. Now as evident from the chart it looks like a case of a double bottom at 0.145 level with the neckline of 0.280 level.
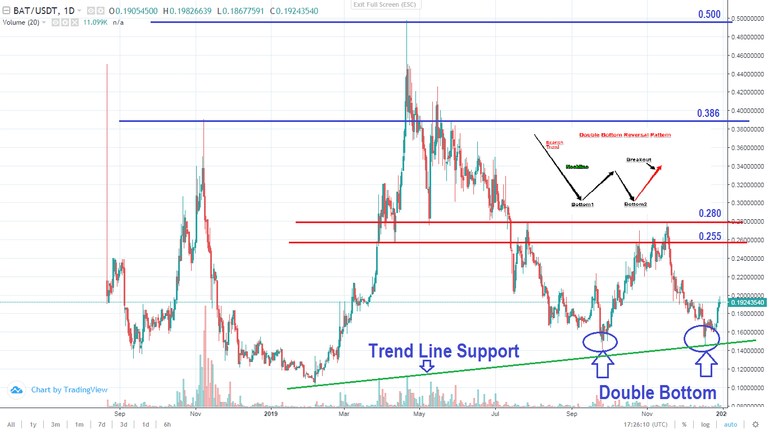
If the recent bounce of 0.198(as recorded today) from 0.145 level gets sufficient traction then it is well-positioned now for a test of at least 0.280 in the near term. Further, combining with the seasonal trend & going into the first quarter of 2020, if there will be enough bullish sentiment in the altcoin segment, then it is very probable that BAT/USD can have a breakout above 0.280 to test the next level of resistance which is 0.386 followed by 0.050(the high of 2019).
https://twitter.com/Milaan88778502/status/1211732930789199872
Thanks for sharing your technical analysis. This month/week confirmed the test of the resistance at 0.280 hope you were able to profit from trading BAT/USD.