BTCUSD position Day 69 of 100DAYSOFTA
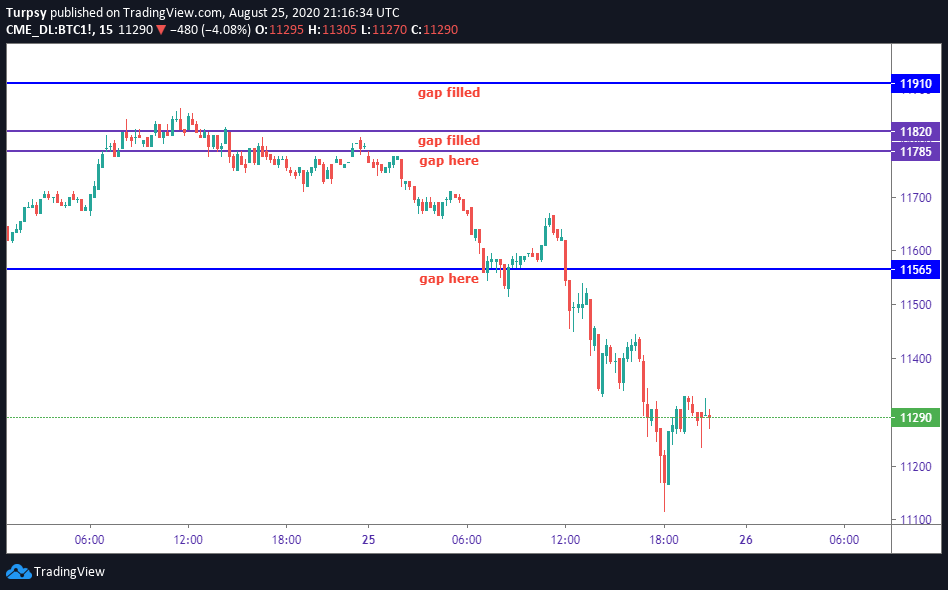
These are the gaps still actively open on the CME chart. We may or may not fill them all. Looking at the chart these gaps are slowing getting filled as the price grinds downwards.
11900 USD.- Filled
11820- Filled
11785 Not yet Filled
11580, Not yet Filled
10255, -Not yet
9955, -Not yet
9215 -Not yet
8840 USD. - Not yet
https://www.tradingview.com/x/CckVHOmZ/
This is my entry for the 100DAYSOFTA challenge, Tuesday 25th August 2020.
__
I am joining a challenge by a group of traders. The challenge is #100DAYSOFTA. Some of the people in this group have posted on $Youtube, $Twitter but I will be posting mine on Hive.
The convener of this challenge is https://twitter.com/CryptoluXP
However, the frequency might not be daily but it will be sequential.
Having said that, here is what I have:
__
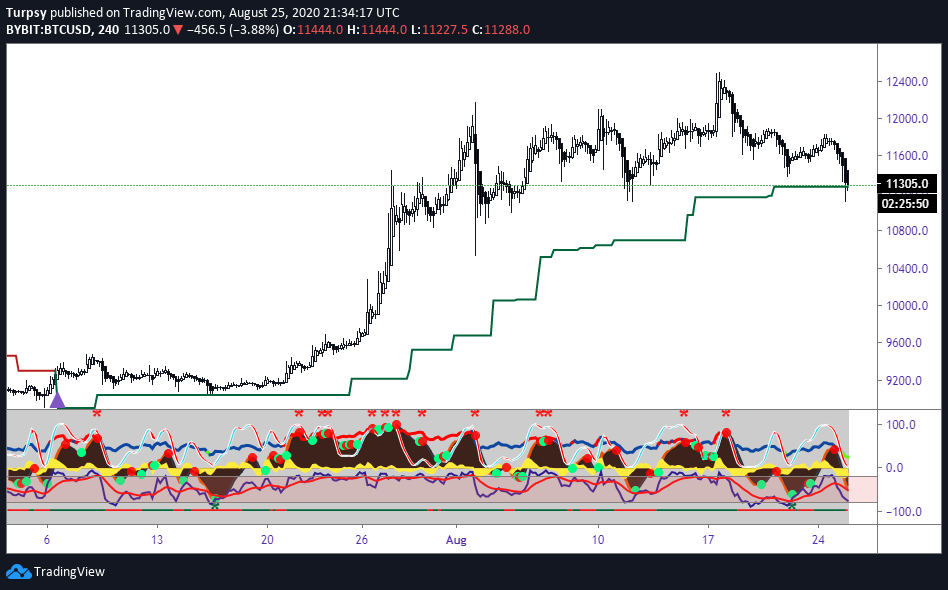
4 hr
Right now is the moment of truth. This is the last level before the tide turns and the trend change to an hopeless bull season. As we can see from the ST, the indicator support has been reached and it is holding so far. However, we should be weary that more downward pressure wont push the prices down. If it does then the ST will flip to short and we will have to wait for another season till the price becomes actively bullish. Willy is also resetting to the oversold region and likeweise the stochastic indicator. This means we may have a structure at this support that can push the price upwards.
https://www.tradingview.com/x/ji5JKVRj/
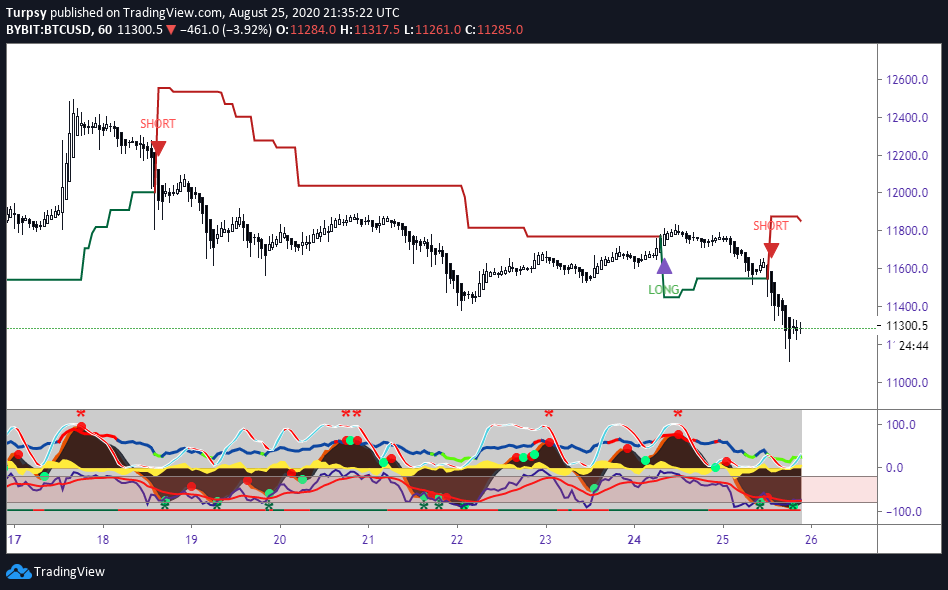
1h
The trend has shifted to the bear and it has also had effect on the price of the BTC. With the price going down rapidly in a space of few hours. The ST is bearish, however, there is an opportunity to have a long buy. Since Willy is already oversold, wave trend indicator showing some sign of strength, and the stochastic indicator also oversold.
https://www.tradingview.com/x/oVOI9JlT/
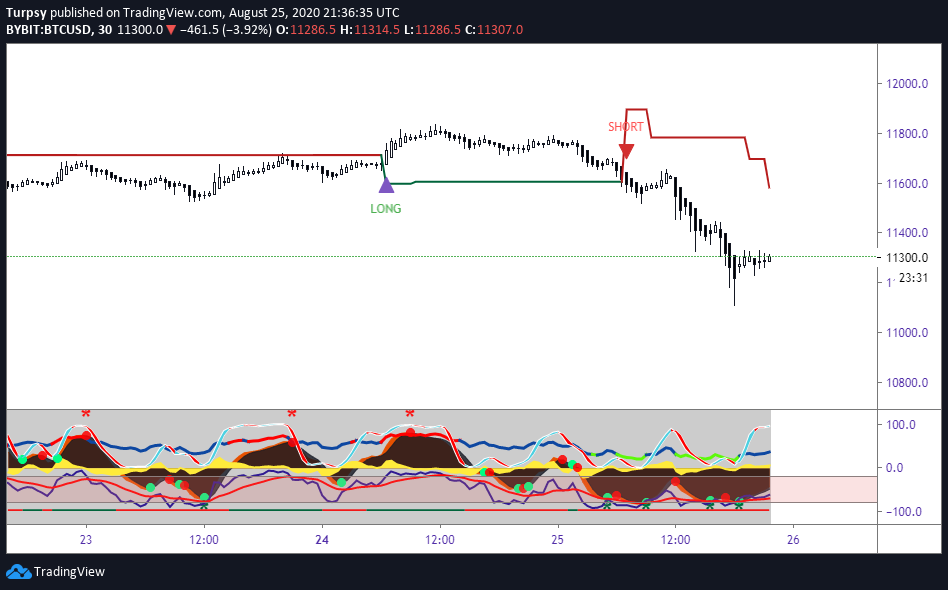
30 mins
The trend here is also bearish, with the price touching the lows of 11111 USD. This is an opportuniuty to get some BTC. However, since the trend is bearish, we should be watchful not to trade without proper risk management. Willy is also oversold and might be correcting upward soon. Wave trend indicator is also showing a sign of bull around the corner. But stochastic indicator is showing that prices is already up and might temporarily correct downwards
https://www.tradingview.com/x/sovMCzas/
Extras
15mins and 5 mins charts respectively.
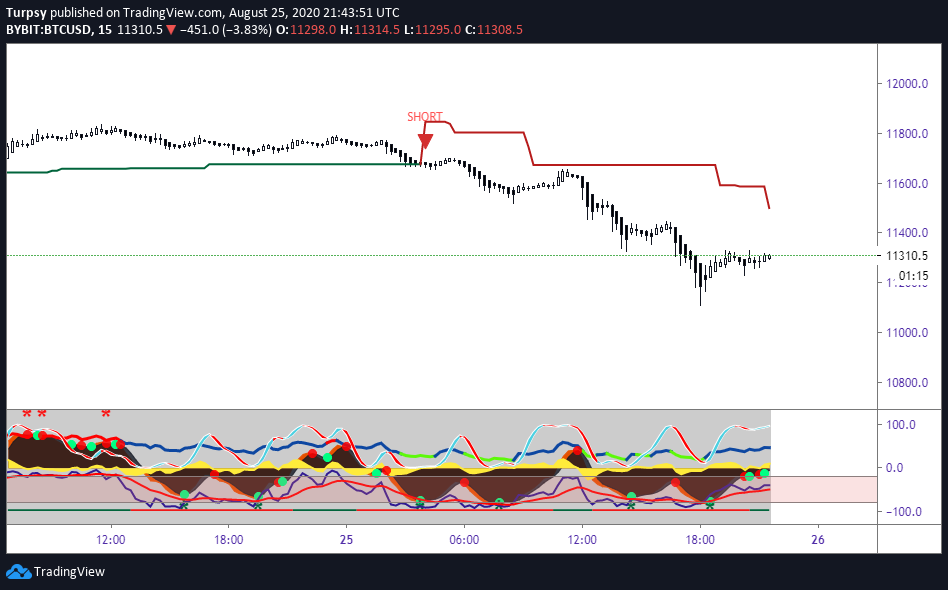
https://www.tradingview.com/x/2jCuegfk/
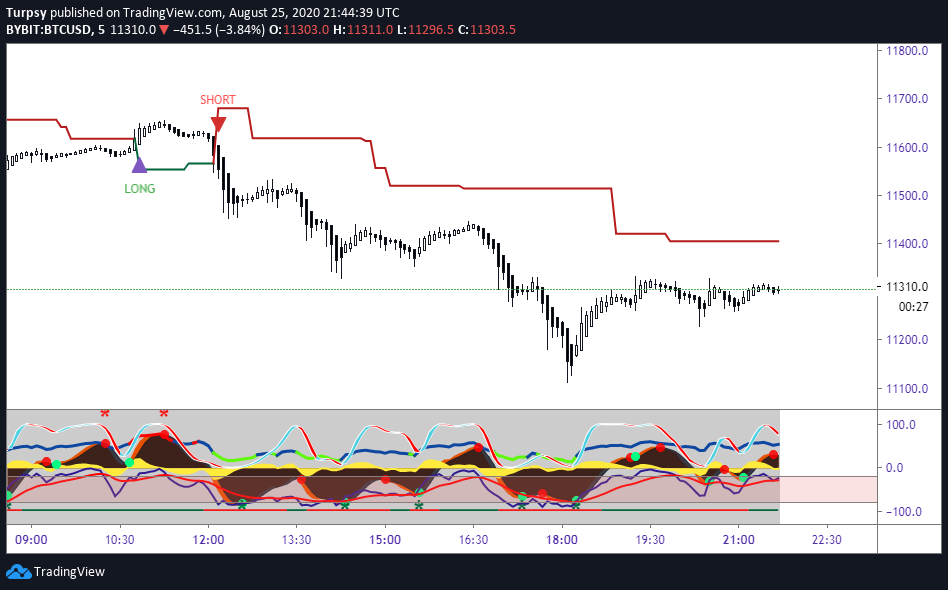
https://www.tradingview.com/x/S9TZCRoC/
Summary:
4hrs ST is long
1hr ST is short
30 mins ST is short
My Position
I will be looking for a long if the 4hr is not closing below the 11111 USD.