BTCUSD position Day 64 of 100DAYSOFTA
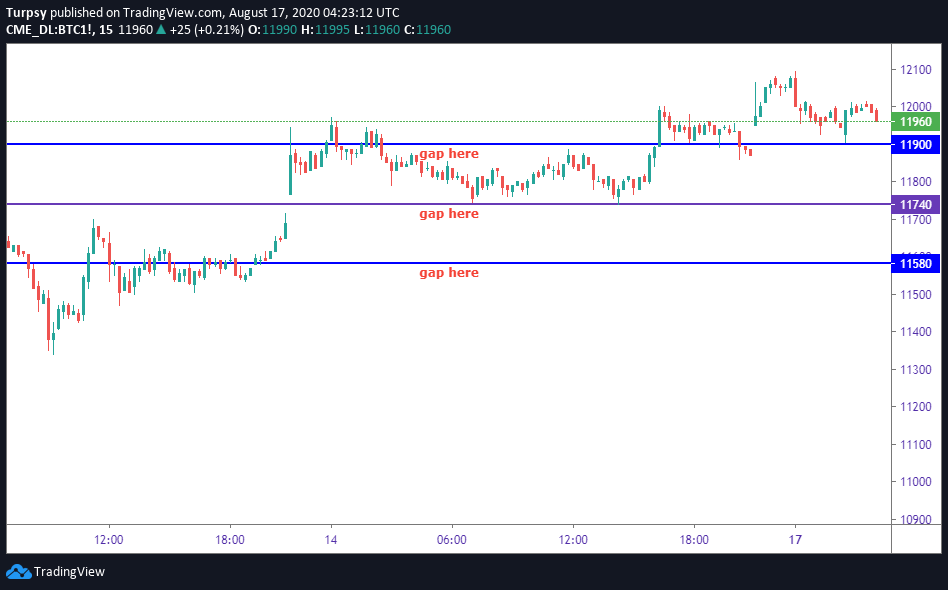
Welcome to a new week and we are definitely being greeted with new gaps on the CME chart.
11900 USD.- Not yet filled
11740- Not yet filled
11580, Npt yet Filled
11958- Not yet Filled
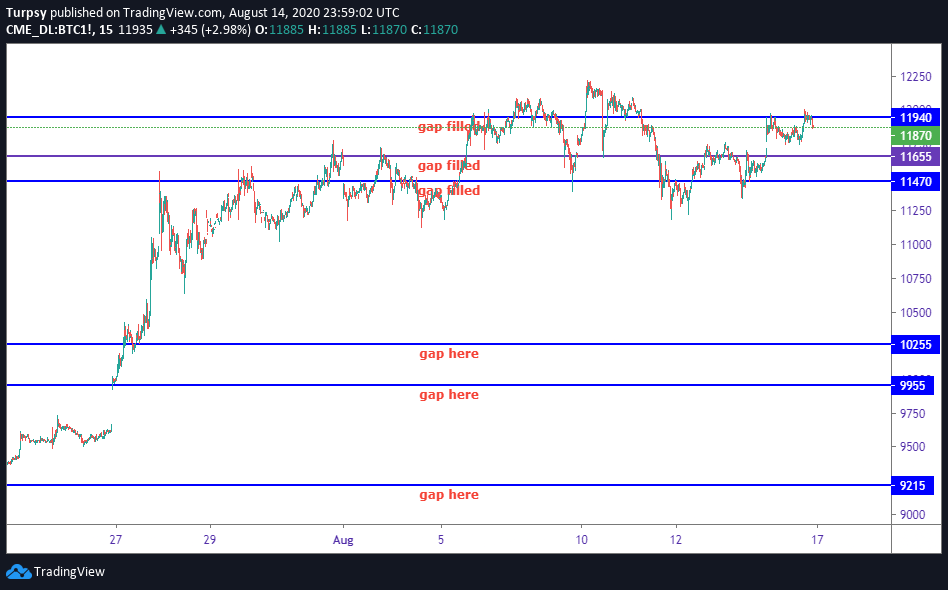
10255, -Not yet
9955, -Not yet
9215 -Not yet
8840 USD. - Not yet
As we can see in the chart below these gaps are definitely something we need to keep an eye on. Even though the trend is bullish we should be careful that there can be moments of drawdown. These should not come as a surprise.
https://www.tradingview.com/x/GZQ2Qly2/
https://www.tradingview.com/x/HzY4au3O/
The price action has been impressive for the past days since we have been having good support level.
This is my entry for the 100DAYSOFTA challenge, Monday 17th August 2020.
__
I am joining a challenge by a group of traders. The challenge is #100DAYSOFTA. Some of the people in this group have posted on $Youtube, $Twitter but I will be posting mine on Hive.
The convener of this challenge is https://twitter.com/CryptoluXP
However, the frequency might not be daily but it will be sequential.
Having said that, here is what I have:
__
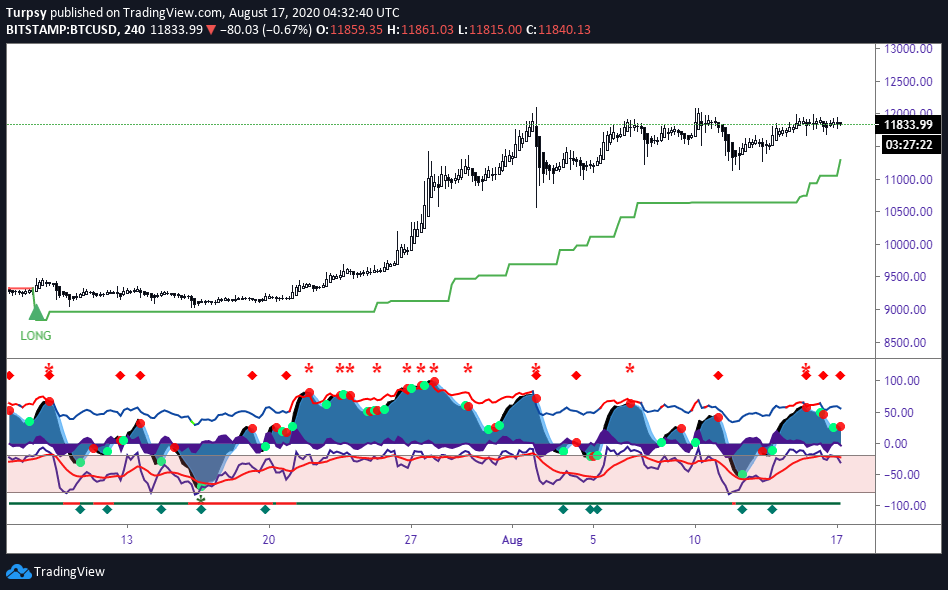
4 hr
This chart consists of a new type of indicator. That is the wavetrend which is similar to the popular Market cipher. However, I will not be diving too much to the explanation of the market cipher but I will be making one or two references to it, if possible. Mostly, I will stick to the ST and Willy which I normally use.
On this TF , ST is still long and the invalidation is around 11200 USD now. This suggests that we are expecting that level to serve as support for the price action. The price is however facing a lot of resistance and also support around this region. Also, looking at the Willy we can see that the willy is now trending downwards with a probability of resetting from the overbought to the oversold region. However, this doesn't mean the price is going to dump crazily but it suggests that there is a momentum building for buyers to be able to step in again. Ftom the wavetrend we can see it has red dot which means a sell is imminent.
https://www.tradingview.com/x/u0IXGEOh/
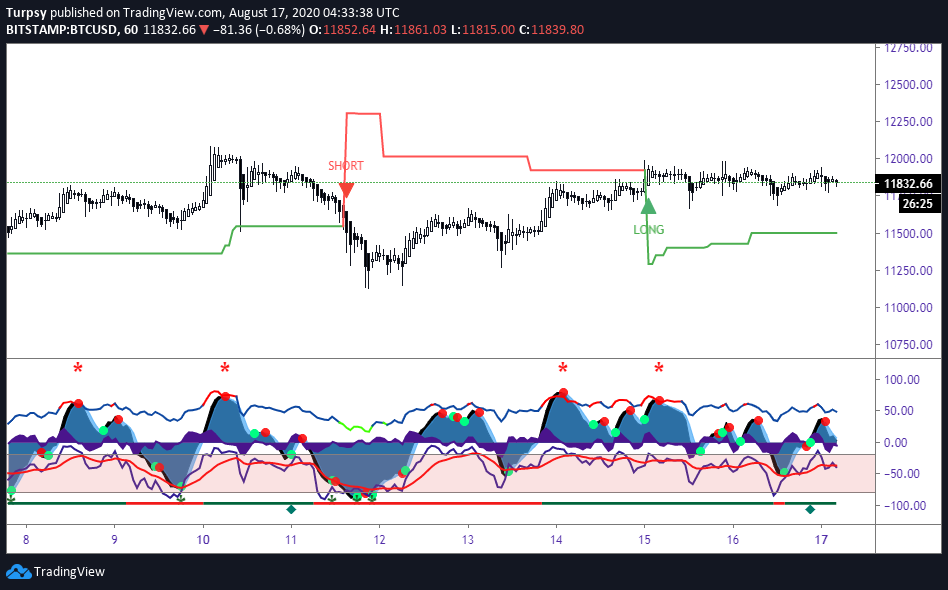
1h
On this TF and chart we can see that the price has been ranging basically. No serious push either to the upside or the downside. Also, this TF has been a great support in the penultimate trend. We can see the trend is still our friend and favoring the long with invalidation at a close below 11500USD. This is what we should lookout for. Willy is not too definite in the direction, since we can see that it looking for a reset from the overbought zone it was.
Market cipher is also favoring a sell to the buy zone below
https://www.tradingview.com/x/qzspNCde/
30 mins
It seems the cle for the price movement is on the 30 minutes TF, we have a clear support on this. 11700 USD is almost the support we should be looking out for incase of any dump. zif the price holds at this level, we have the opportunity to go higher. If it doesn't, then we should expect more lower price action. However, willy is at the oversold region which means the prices might still dump some more to give a double bottom at that level.
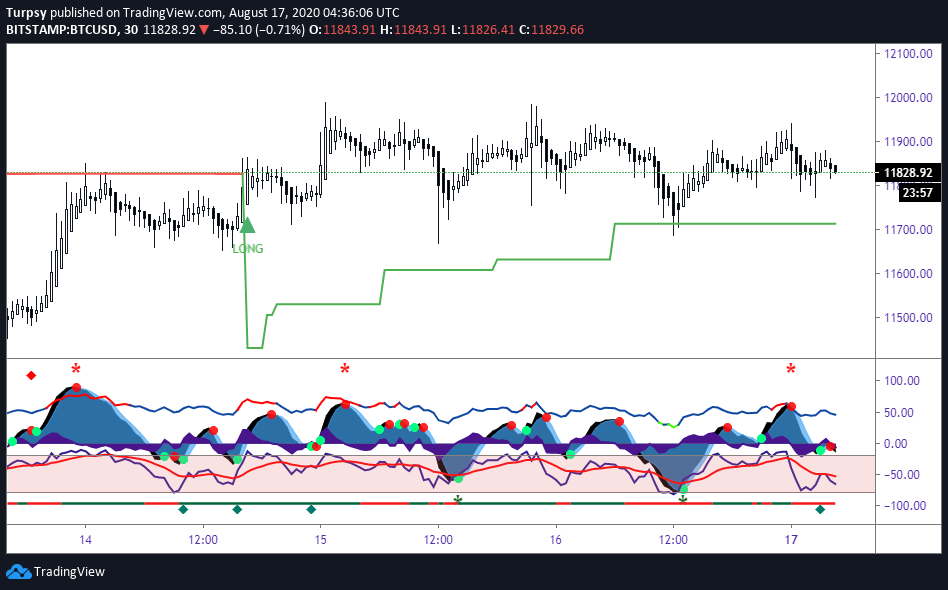
https://www.tradingview.com/x/TE63Si8g/
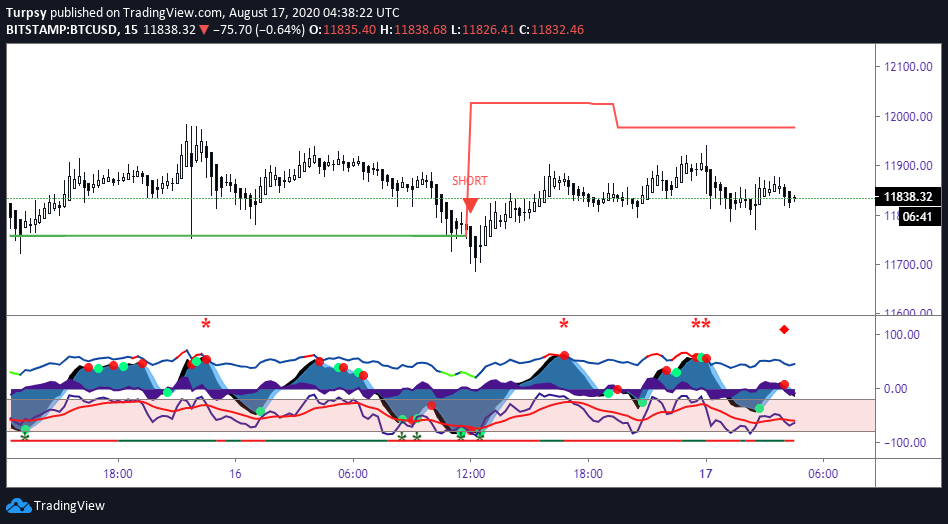
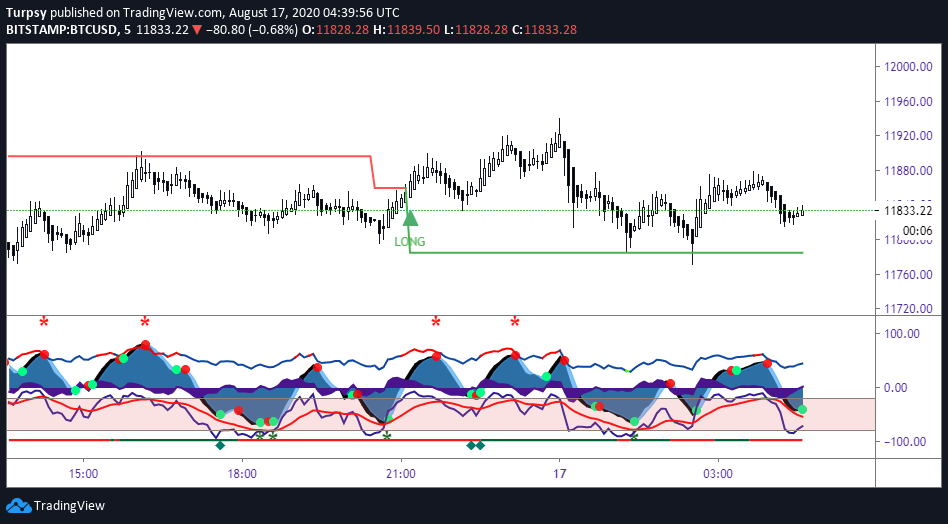
Extras
15mins and 5 mins charts respectively.
https://www.tradingview.com/x/DqdatbyQ/
https://www.tradingview.com/x/qXhxqQS7/
Summary:
4hrs ST is long
1hr ST is long
30 mins ST is long
My Position
I will be looking like a hawk to pick the best price to enter a long position if the 1 hour ST confirms long. Also, the 30 minutes support around 11700 USD looks good.
These are the probabilities I am looking at.
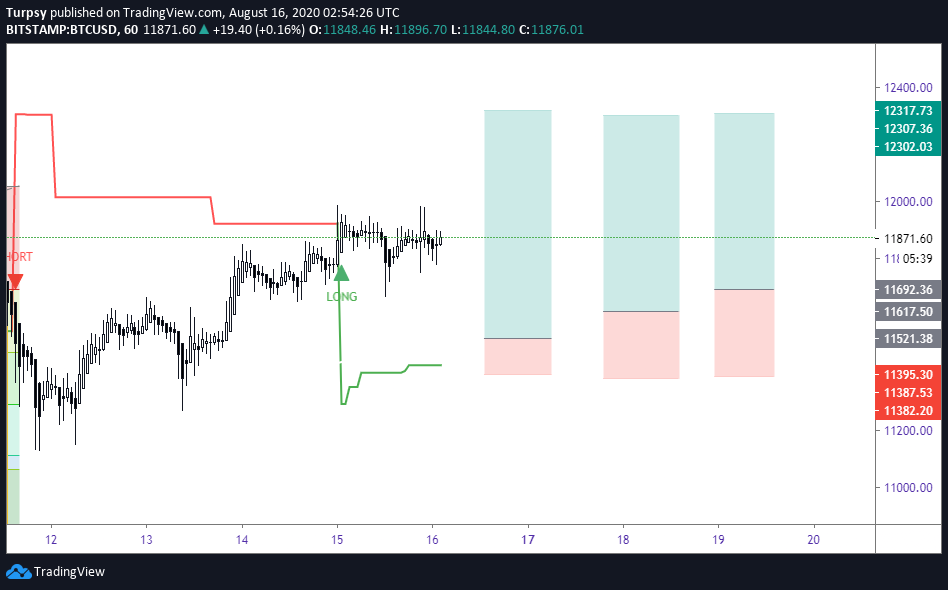
https://www.tradingview.com/x/ofJjNKlk/