How to grow your trading account: Exponential Moving Averages
There are two factors that significantly affect the price as regards simple moving averages; the new one that is being added and the old one that is being dropped. If the old price that is to be dropped is very high, the moving average will change in direction drastically. This singular reason makes the simple moving average flawed. This flaw is usually very significant when the time period is short. An indicator that is affected significantly by a drop in very old prices most times does not reflect the current market situation hence the need for an indicator that responds mainly to the present situation of the market.
In this post, I will be talking about exponential moving averages and why new traders use it more when compared to the SMA.
On this note, I welcome you to another edition of how to grow your trading account.
What is an Exponential Moving average?
An exponential moving average is one type of moving average that regards the recent price more than the old price.
According to the balance.com
The exponential moving average (EMA) is a weighted average of the last n prices, where the weighting decreases exponentially with each previous price/period.
This, therefore, means that a drop in an old price will not significantly affect the signal given by an EMA because the price will not account for as much as the average price. As a trader, you are concerned about what the traders are doing now than what they did last month or sometime in the past hence the importance of exponential moving average.
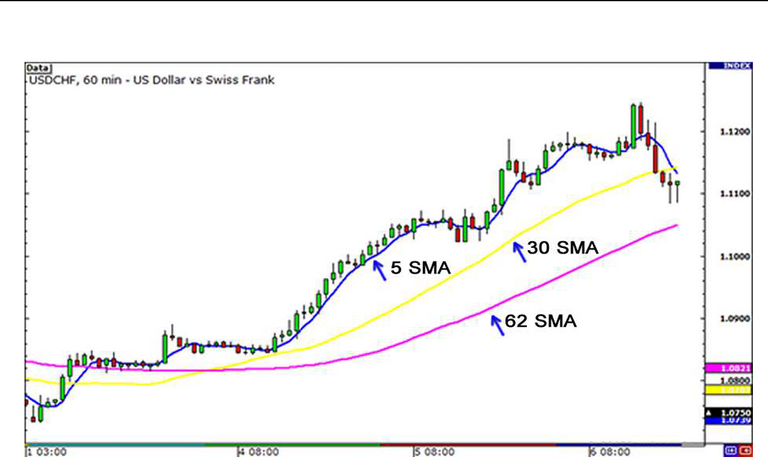 This is a screenshot of a chart showng 3 different EMAs; 5,30, and 62 day EMA. The five day EMA is closest to the price and so will react first. The 62 day EMA is farthest from the price and will reactb slowest.
Formula
where
K = 2/(N+1)
N =the number of days in the EMA (chosen by the trader).
Ptod=today’s price.
EMAyest=the EMA of yesterday.
From this formula, the new price accounts for a huge percent of the average price. For example, if we were to use a five-day EMA Ptod (today's price) will account for 33% of the average price while if it was a ten-day exponential moving average Ptod will account for 18%. This further makes EMA more useful to a trader than a simple moving average as regards the present situation of the market.
Example
If the price of a currency pair for the past 5 days was 1.1100, 1.520, 1.1125, 1.1128, 1.1120 with the yesterday EmA at 1.1120. Calculate the EMA
Solution
Step 1
Calculate K
K= 2/ (5+1)
= 0.33
Step 2
Calculate the EMA
Ptod = 1.1120
n = 5 days
EMA yesterday= 1.1120
= 0.37+ 0.7450
=1.1150
The EMA is 1.1150
Significance
EMAs are pretty much easy to use and they signify the same thing as SMA. When the price is trading above the EMA it signifies an uptrend and when the price is trading below it, it signifies that the market is on a downtrend. Due to the fact that EMAs respond fast to the current market situation, there are chances that you will encounter a lot of whipsaws and very early signals that might be as a result of recent news but not necessarily the formation of a trend. Hence the need to verify the signals before executing a .trade.
Like I earlier said, you need an indicator that tells you what is happening currently, however you also need an indicator that will reduce fake outs.
One way to minimize these fake outs is to have more than one exponential moving average like a fast and a slow one. You could combine a 5 day EMA with a 10 day EMA. This makes the signal stronger. So when the price is above the both EMAs it signifies a strong uptrend and vice versa if below.
Another way to use EMA is in cross over trading implying reversal trading. Once the EMA with the shorter duration crosses over the longer EMA, these most times imply a reversal of a trend.
On a final note, you have to combine this with the strategy that you have backtested to have a higher chance of making a profit. I prefer to combine with stochastic and candlestick patterns. My advice is for you to choose what works for you.
Thank you for reading my blog.
!BEER
View or trade
BEER.Hey @bhoa, here is a little bit of
BEERfrom @gamsam for you. Enjoy it!Learn how to earn FREE BEER each day by staking your
BEER.This post has been manually curated by @bala41288 from Indiaunited community. Join us on our Discord Server.
Do you know that you can earn a passive income by delegating to @indiaunited. We share 80 % of the curation rewards with the delegators.
Here are some handy links for delegations: 100HP, 250HP, 500HP, 1000HP.
Read our latest announcement post to get more information.
Please contribute to the community by upvoting this comment and posts made by @indiaunited.
!bro test
!bro
!BEER
View or trade
BEER.Hey @bhoa, here is a little bit of
BEERfrom @gamsam for you. Enjoy it!Learn how to earn FREE BEER each day by staking your
BEER.