Crypto Analysis | 99% Sure that this is the Bottom!
Good day Hiveians!
Join me in analyzing the crypto markets!
The last weeks have been very interesting to watch the market
I put out several ideas of what we might see and I think most of them have actually held up. With the Pi-Cycle Top indicator crossing last week, I'm sure that many people are on edge that this has marked the end of the bull cycle. But there are many reasons for why this isn't the case. But a natural reaction of the market is a (mid sized) sell off. So far we had a 25% correction from the top, which is not that big compared to the 40-60% corrections which are bound to happen in a bull market.
So what makes me think that this is the bottom for this correction? As pointed out in my last post, the market was "saved" by the "orange line". A small dip below that as we are seeing now is still nothing to get excited about. It happened several months before as well. The high degree of confidence, however, comes rather from 2017 where we saw the exact same pattern play out. This is what happened back then:
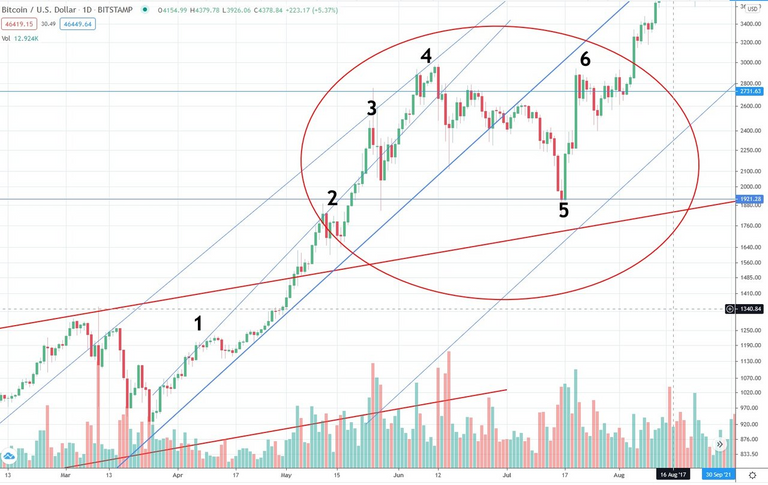
We broke through the middle thick blue line and corrected to the "orange line". After this there was a big impulse wave taking the price back to where it started. I expect the same thing to happen again. However, as the support line is much higher in this cycle this movement has been compressed. Have a look:
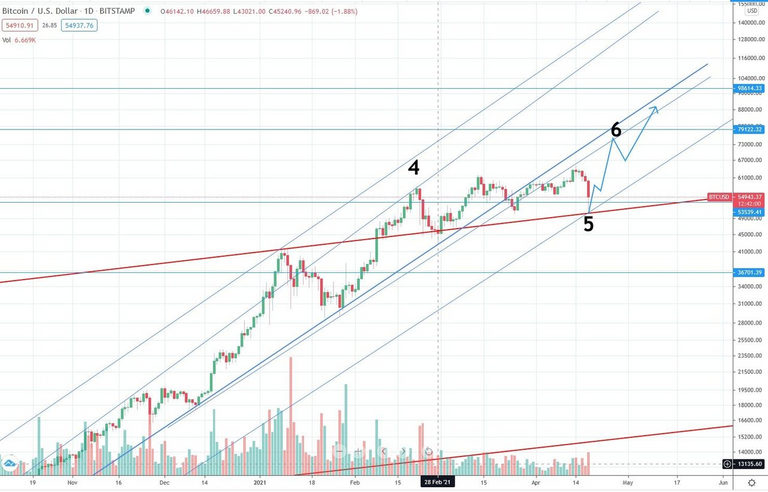
This "5" is where the correction should end. Again, as mentioned above price has dipped below that a bit, but that should only be a small spike. Price should sharply increase from here on. A further correction to ~40k seems very unlikely to me and if there is not a big negative news event, 48k should be the low.
We also had a look at Ethereum some time ago in which I argued that it would see a big price increase (especially compared to BTC).These are the forecasts:
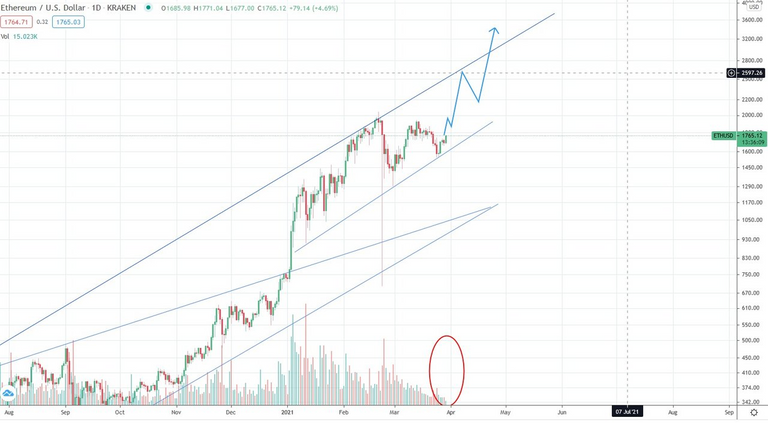
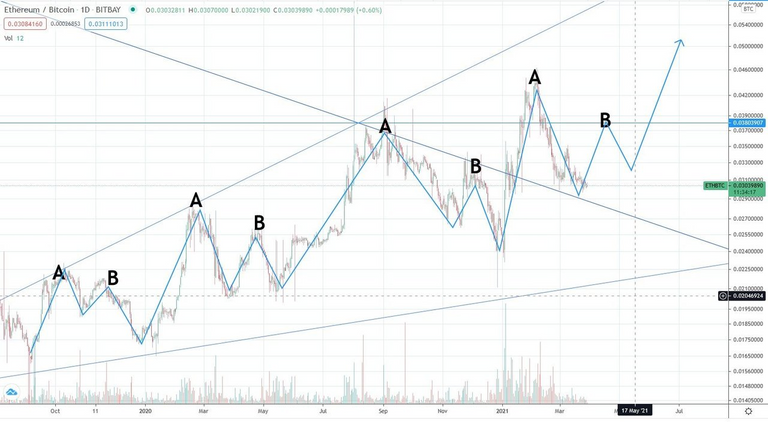
And here is what happened:
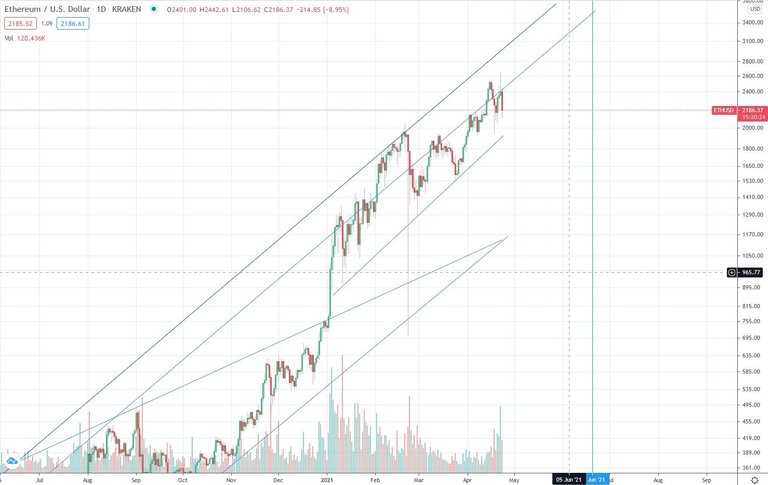
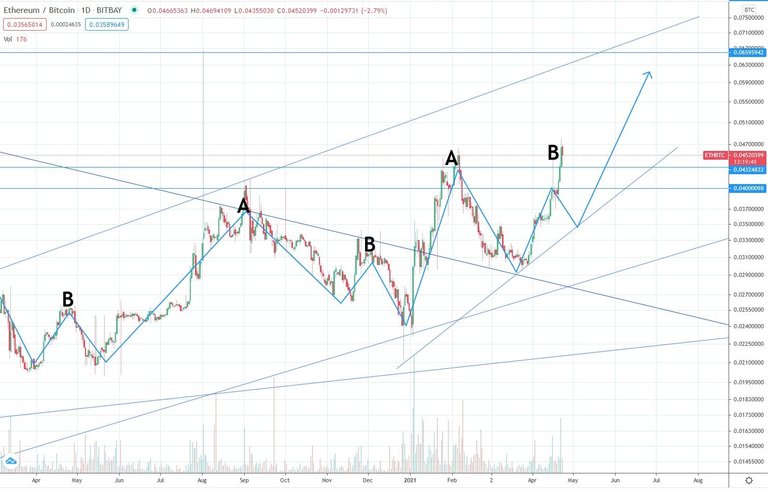
Not bad? Notice how the "B" has been higher than the "A" in the ETH/BTC chart. This indicates to me that the "B" is actually going to go as high as 0.65 to meet the upper resistance line.
As a general reminder: Please keep in mind that none of this is official investment advice! Crypto trading entails a great deal of risk; never spend money that you can't afford to lose!


Check out the Love The Clouds Community if you share the love for clouds!

Most of the ones who sold the past 24 hours will be back buying at $60k.
Posted Using LeoFinance Beta
yes indeed... after doing this for some years some figure it out the hard way (myself included ;D
You seem to have figured it out quite well.
Posted Using LeoFinance Beta
I want to give the government as little as possible, which is why I have developed diamond fists in the past few years. I only sell buy near the cycle bottoms and just HODL until I figure the top is in. The past history of Bitcoin makes that relatively easy.
Posted Using LeoFinance Beta
This 99% sure honestly does not give me hope...
But I do like your analysis and I do hope it holds true, I can see you have predicted correctly the ETH price action, let's see if you'll predict this as the bottom as well :D
Cheers
Posted Using LeoFinance Beta
the only other scenario I see currently is the one back from 2013 when we had a double peak for the bull cycle; either way, everything should be 2x+ in some months time again
Hi! I think we might see a test of the 21 weekly ema, (and a support resistance flip off previous high) haven't been tested since 10k and it we did test it a couples of times in last bull run.. What do you think? Hope it holds :)
yes, that's definitely an option, but I have faith in the "orange line" :D
And the NVT has flipped, its been bullish all of the run, but I think we will have a relif bounce here anyway, there is bullish divergence showing up.. But im hoping your "orange line" hold :)