Trendline Discovery with Bitcoin Price
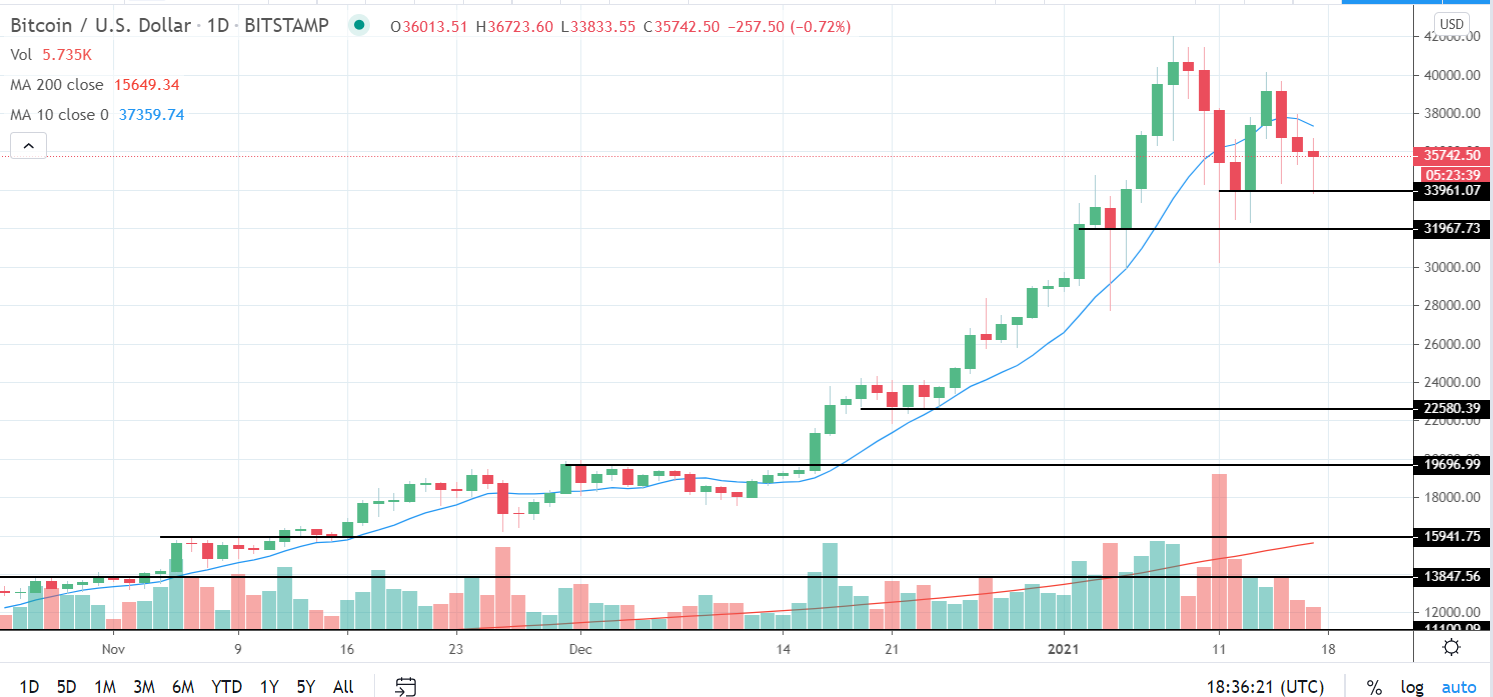
With this chart of daily bitcoin price I decided to clear off all lines outside of potential support areas.
Is Price Creating a New Support...
34K making a presence, maybe...
Looking at the chart you will see the upper most line drawn at roughly 34K. This price represents the opening/closing level of the last little bottom, a price that today's candle has bounced off of.
This is very early speculating as today's candle has many hours till it closes and we'd need to see price remain above 34K for atleast a few days in my opinion before I will validate the level as a new support.
Next up 32k....
We saw heavy consolidation back on January 3rd to the 5th and this could be a potential support as well.
Anything below that I don't want to acknowledge hahah.
Posted Using LeoFinance Beta
0
0
0.000
This is not the end of the bull run by the way, this is my belief, I still feel btc might even fall to 25k or less, but then we still have a long way to go and before December we might see 60 or 70k
Posted Using LeoFinance Beta
When some altcoins analysis? LTC, ETH, XMR?
Posted Using LeoFinance Beta
Good Call! I'm well overdue on ETH, been a couple weeks. I'll throw in an LTC soon too.
Posted Using LeoFinance Beta
Waiting for LTC.
Posted Using LeoFinance Beta
The support line, it is better to draw at the candlestick minimum and not at the close.
Better to take the low of the bar for January 21st.
Posted Using LeoFinance Beta
If it falls down, I'll simply buy more because I believe we're only starting the era of blockchain and crypto!
Posted Using LeoFinance Beta
Exactly! I bought more at 32K on the last dip, have orders sitting at 29.5K still.
Posted Using LeoFinance Beta
https://twitter.com/shortsegments/status/1353297731595366400