WHAT IS NOW FOR BITCOIN [TR-EN]
[EN] Good night everybody. Let's continue with Bitcoin again. As you know, it was stuck at the $ 13850 level, it remained. Before that, it was stuck at the $ 8400, $ 9189, $ 10000 levels just like these days, and it suffered from these resistances for a while. As a result, he managed to bypass all
[EN] Good night everybody. Let's continue with Bitcoin again. As you know, it was stuck at the $13850 level, it remained. Before that, it was stuck at the $8400, $9189, $10000 levels just like these days, and it suffered from these resistances for a while. As a result, he managed to bypass all these steps and obstacles one by one. Bitcoin does. I guess I don't need to remind you where you came to these levels. Let's see what we will see in the future.
BTCUSD SELL SIGNAL IN THE HOURLY GRAPH
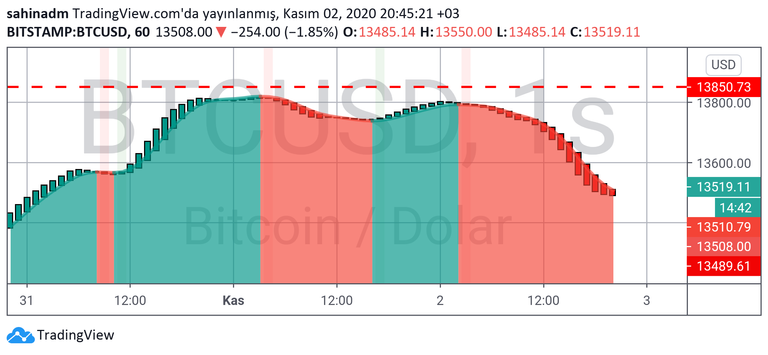
The SELL signal continues on the hourly chart, which this time brought prices up to the $13500 level. Movements of about $400 or $500 are small for Bitcoin, but it may seem like a high value move to people because it hasn't moved as hard as it used to for a long time. It can naturally create an atmosphere of panic. There are also those who perceive these corrections as preparing for the rise.
As a result of the hourly sales, with support from the $13220 level, the hourly chart is rising again, with resistance at $13850 and $14100. Let's see that $11200, which we can call attention below, is always possible. But the first stop is $13014 support.
BTCUSD SELL SIGNAL IN 4-HOUR GRAPH
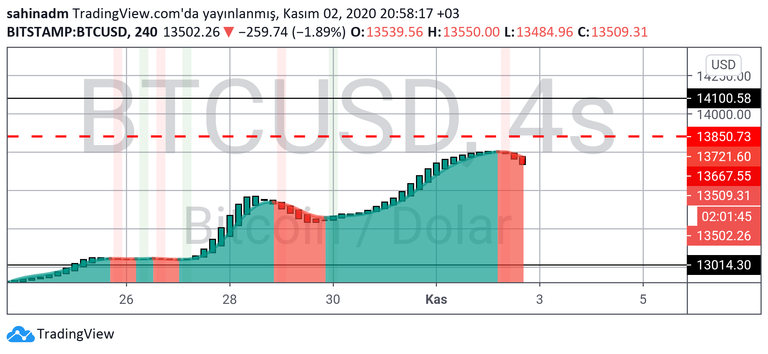
With the sell signals coming approximately 12 hours ago, the 4-hour chart tried to normalize 8 hours ago. SELL signal is not finished yet; However, some investors who found around $13200 suitable enough, made purchases and prevented the decline from going deep. Only SELL signal continues. It is useful to be careful. Because when this chart is in a selling position, if there is no good strategy, no purchase is made.
It's good to stick to the same supports and resistances as the hourly charts. This situation is rare. Normally it moves harder and pierces the supports of the hourly chart. The same is true for resistors in the buy position.
BTCUSD BUY SIGNAL IN DAILY GRAPH
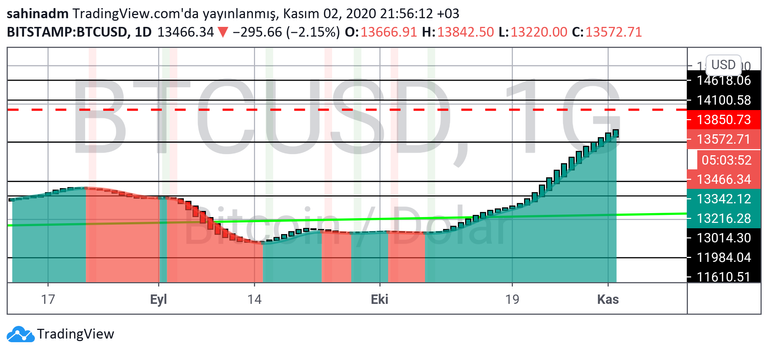
The daily chart continues as if nothing happened. This is the main reason why prices do not fall too much. This does not mean that nothing is happening to the daily chart. This steep stance is only because the trend change is slower than the hourly and 4-hour chart.
It makes us happy in the uptrend, but it is extremely annoying in the downtrend. Things are good for now but there should be a BUY signal on the 4-hour chart as soon as possible. Otherwise, things will go wrong.
Let's not forget the $11200 level on the daily chart. The $13850 resistance should be broken as soon as possible so that this level does not recur.
An experienced and strong investor with a strategy knows how to save himself from any bad situation; but new and novice users should be very careful.
İyi akşamlar herkese. Yine Bitcoin ile devam edelim. Bildiğiniz gibi 13850$ seviyesine takıldı, kaldı. Bundan önce 8400$, 9189$, 10000$ seviyelerinde de aynen şu günlerde olduğu gibi takılmıştı ve bir süre bu dirençlerle uğramıştı. Sonuç olarak tüm bu adımları, engelleri atlamayı bir bir başarmıştı. Bitcoin yapar. Bu seviyelere nerelerden geldiğini hatırlatmama gerek yok sanırım. Bakalım neler göreceğiz ileriki dönemlerde.
***BTCUSD SAATLİK GRAFİKTE SAT SİNYALİ ***
Saatlik grafikte SAT sinyali devam ediyor ve bu sinyal bu kez fiyatları 13500$ seviyesine kadar getirdi. Yaklaşık 400 veya 500 Dolarlık hareketler Bitcoin için ufak kalıyor ama uzun bir süredir eskisi gibi sert hareket etmediği için insanlara yüksek bir değer kımıldaması gibi gelebilir. Doğal olarak panik havası yaratabilir. Oluşan bu düzeltmeleri yükselişe hazırlık gibi algılayanlar da var.
Saatlik satışlar sonucu 13220$ seviyesinden destek alarak tekrar yukarı yönelen saatlik grafikte direnç olarak 13850$ ve 14100$ seviyeleri karşımıza çıkıyor. Aşağıda aman dikkat diyebileceğimiz 11200$ her zaman mümkün görelim. Fakat ilk durak 13014$ desteğidir.
BTCUSD 4 SAATLİK GRAFİKTE SAT SİNYALİ
Yaklaşık olarak 12 saat önce gelen satış sinyalleri ile 4 saatlik grafik 8 saat önce ise normalleşme çabasına girdi. SAT sinyali henüz bitmedi; fakat 13200$ civarını yeteri kadar uygun bulan bir takım yatırımcı, alım yaparak düşüşün derine inmesine engel oldu. Yalnız SAT sinyali devam ediyor. Dikkatli olmakta fayda var. Zira bu grafik satış pozisyonunda iken iyi bir strateji yoksa alım yapılmaz.
Saatlik grafiklerle aynı destek ve dirençlere takılması iyi. Bu durum nadir olan bir durumudur. Normalde daha sert hareket ederek saatlik grağin desteklerini delip geçer. Aynı şey alış pozisyonunda dirençler için de geçerlidir.
BTCUSD GÜNLÜK GRAFİKTE AL SİNYALİ
Günlük grafik hiçbir şey olmamış gibi devam ediyor. Fiyatların çok fazla düşmemesinin en büyük sebebi bu grafik. Bu dediklerim, günlük grafiğe hiçbir şey olmuyor, anlamına gelmez. Sadece trend değişiminin saatlik ve 4 saatlik grafiğe göre daha yavaş olmasından kaynaklanıyor bu dik duruş.
Yükseliş trendinde böyle mutlu ediyor ama düşüş trendinde de aşırı oranda can sıkıyor. Durumlar şimdilik iyi ama 4 saatlik grafikte bir an önce AL sinyali oluşması gerekiyor. Yoksa işler kötüye gider.
Günlük grafikte 11200$ seviyesini unutmayalım. Bu seviyenin tekrar etmemesi için 13850$ direnci bir an önce kırılmalı.
Strateji sahibi tecrübeli ve güçlü yatırımcı her türlü kötü durumdan kendini kurtarmasını bilir; ama yeni ve acemi kullanıcılar çok dikkatli olmalı.
Yazıyı buradan da görüntüleyebilirsiniz. Kolay gelsin.

Analizlerim hiçbir şekilde yatırım tavsiyesi değildir, genel durumu belirlemek içindir. Bu analizler al/sat yapmaya uygun değildir. Bu analizlere dayanarak yapılan alım veya satımlardan doğacak zararlardan yatırımcı sorumludur.
Grafikler, www.tradingview.com grafik veri sunucusunda @sahinadm tarafından oluşturulmuştur. steps and obstacles one by one. Bitcoin does. I guess I don't need to remind you where you came to these levels. Let's see what we will see in the future.
BTCUSD SELL SIGNAL IN THE HOURLY GRAPH
The SAT signal continues on the hourly chart, which this time brought prices up to the $ 13,500 level. Movements of about $ 400 or $ 500 are small for Bitcoin, but it may seem like a high value move to people because it hasn't moved as hard as it used to for a long time. It can naturally create an atmosphere of panic. There are also those who perceive these corrections as preparing for the rise.
As a result of the hourly sales, with support from the $ 13220 level, the hourly chart is rising again, with resistance at $ 13850 and $ 14100. Let's see that $ 11200, which we can call attention below, is always possible. But the first stop is $ 13014 support.
BTCUSD SELL SIGNAL IN 4-HOUR GRAPH
With the sell signals coming approximately 12 hours ago, the 4-hour chart tried to normalize 8 hours ago. SAT signal is not finished yet; However, some investors who found around $ 13200 suitable enough, made purchases and prevented the decline from going deep. Only SAT signal continues. It is useful to be careful. Because when this chart is in a selling position, if there is no good strategy, no purchase is made.
It's good to stick to the same supports and resistances as the hourly charts. This situation is rare. Normally it moves harder and pierces the supports of the hourly chart. The same is true for resistors in the buy position.
BTCUSD BUY SIGNAL IN DAILY GRAPH
The daily chart continues as if nothing happened. This is the main reason why prices do not fall too much. This does not mean that nothing is happening to the daily chart. This steep stance is only because the trend change is slower than the hourly and 4-hour chart.
It makes us happy in the uptrend, but it is extremely annoying in the downtrend. Things are good for now but there should be a BUY signal on the 4-hour chart as soon as possible. Otherwise, things will go wrong.
Let's not forget the $ 11200 level on the daily chart. The $ 13850 resistance should be broken as soon as possible so that this level does not recur.
An experienced and strong investor with a strategy knows how to save himself from any bad situation; but new and novice users should be very careful.
İyi akşamlar herkese. Yine Bitcoin ile devam edelim. Bildiğiniz gibi 13850$ seviyesine takıldı, kaldı. Bundan önce 8400$, 9189$, 10000$ seviyelerinde de aynen şu günlerde olduğu gibi takılmıştı ve bir süre bu dirençlerle uğramıştı. Sonuç olarak tüm bu adımları, engelleri atlamayı bir bir başarmıştı. Bitcoin yapar. Bu seviyelere nerelerden geldiğini hatırlatmama gerek yok sanırım. Bakalım neler göreceğiz ileriki dönemlerde.
***BTCUSD SAATLİK GRAFİKTE SAT SİNYALİ ***
Saatlik grafikte SAT sinyali devam ediyor ve bu sinyal bu kez fiyatları 13500$ seviyesine kadar getirdi. Yaklaşık 400 veya 500 Dolarlık hareketler Bitcoin için ufak kalıyor ama uzun bir süredir eskisi gibi sert hareket etmediği için insanlara yüksek bir değer kımıldaması gibi gelebilir. Doğal olarak panik havası yaratabilir. Oluşan bu düzeltmeleri yükselişe hazırlık gibi algılayanlar da var.
Saatlik satışlar sonucu 13220$ seviyesinden destek alarak tekrar yukarı yönelen saatlik grafikte direnç olarak 13850$ ve 14100$ seviyeleri karşımıza çıkıyor. Aşağıda aman dikkat diyebileceğimiz 11200$ her zaman mümkün görelim. Fakat ilk durak 13014$ desteğidir.
BTCUSD 4 SAATLİK GRAFİKTE SAT SİNYALİ
Yaklaşık olarak 12 saat önce gelen satış sinyalleri ile 4 saatlik grafik 8 saat önce ise normalleşme çabasına girdi. SAT sinyali henüz bitmedi; fakat 13200$ civarını yeteri kadar uygun bulan bir takım yatırımcı, alım yaparak düşüşün derine inmesine engel oldu. Yalnız SAT sinyali devam ediyor. Dikkatli olmakta fayda var. Zira bu grafik satış pozisyonunda iken iyi bir strateji yoksa alım yapılmaz.
Saatlik grafiklerle aynı destek ve dirençlere takılması iyi. Bu durum nadir olan bir durumudur. Normalde daha sert hareket ederek saatlik grağin desteklerini delip geçer. Aynı şey alış pozisyonunda dirençler için de geçerlidir.
BTCUSD GÜNLÜK GRAFİKTE AL SİNYALİ
Günlük grafik hiçbir şey olmamış gibi devam ediyor. Fiyatların çok fazla düşmemesinin en büyük sebebi bu grafik. Bu dediklerim, günlük grafiğe hiçbir şey olmuyor, anlamına gelmez. Sadece trend değişiminin saatlik ve 4 saatlik grafiğe göre daha yavaş olmasından kaynaklanıyor bu dik duruş.
Yükseliş trendinde böyle mutlu ediyor ama düşüş trendinde de aşırı oranda can sıkıyor. Durumlar şimdilik iyi ama 4 saatlik grafikte bir an önce AL sinyali oluşması gerekiyor. Yoksa işler kötüye gider.
Günlük grafikte 11200$ seviyesini unutmayalım. Bu seviyenin tekrar etmemesi için 13850$ direnci bir an önce kırılmalı.
Strateji sahibi tecrübeli ve güçlü yatırımcı her türlü kötü durumdan kendini kurtarmasını bilir; ama yeni ve acemi kullanıcılar çok dikkatli olmalı.
Yazıyı buradan da görüntüleyebilirsiniz. Kolay gelsin.
Analizlerim hiçbir şekilde yatırım tavsiyesi değildir, genel durumu belirlemek içindir. Bu analizler al/sat yapmaya uygun değildir. Bu analizlere dayanarak yapılan alım veya satımlardan doğacak zararlardan yatırımcı sorumludur.
Grafikler, www.tradingview.com grafik veri sunucusunda @sahinadm tarafından oluşturulmuştur.