TTM Squeeze 7/16/20…Trade Set-Up On NZD/CAD - Part 2

A commodity currency is a name given to currencies of countries which depend on the export of certain raw materials for income. The major currencies that are considered “commodity currencies” are the Australian dollar, Canadian dollar, and New Zealand dollar. So at times trading the New Zealand dollar against the Canadian dollar could be challenging.
The TTM Squeeze Oscillator measures the strength of the market and its momentum and uses the Bollinger Bands and the Keltner Channel as its basis. When volatility increases, the Bollinger Bands widen and engulf the Keltner channel, it is this switch when the Markets transitions from consolidation, to a break out, to a trending Market.
In the absence of significant macroeconomic data releases on Wednesday, risk perception remains as the primary driver of currencies' performance. Earlier in the day, reports showed that Moderna's coronavirus vaccine candidate showed promising results. Additionally, ITV's political editor Robert Peston said Oxford's COVID-19 vaccine was generating "the kind of antibody and T-cell (killer cell) response that the researchers would hope to see."
Boosted by these developments, the risk-sensitive NZD is gathering strength against its rivals. On the other hand, the greenback continues to lose interest as a safe-haven with the US Dollar Index slumping to fresh five-week lows below 96.00.
Meanwhile, Canadian dollar strengthened to a six-day high against the greenback as the Bank of Canada decided against increasing the pace of its bond purchases and promised to keep interest rates at 0.25%, a level it considers the floor, until the economy in Canada picks up.
So why do I like to look at all the other currencies against the dollar? Since the US dollar is the base currency, it can give me a trading edge when deciding to trade the other currencies among themselves.
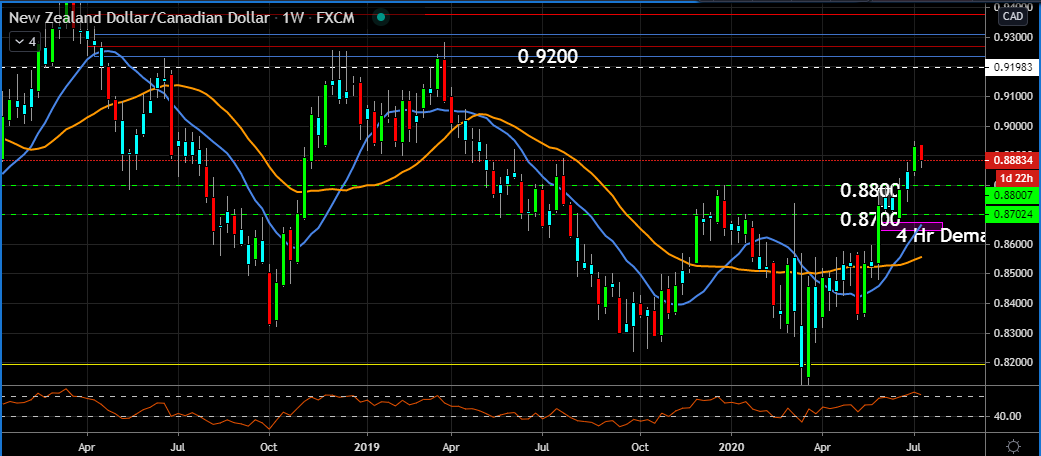
A month ago, I saw a trade set-up on the NZD/CAD. At the time on the daily chart, price was range bound, but the momentum was still to the upside.

On the 4 hr chart price is squeezing, so the chart is suggests to go long above 0.8800 or go short below 0.8700. But if you went short, the was 4 hr demand zone just below.

Since that time, price did a head fake, came within 10 pips of the 4 hr demand zone and has since moved higher.

So now I'm looking for price to retrace back to the origin of the breakout at the 0.8800 level to go long.

The reason the chart suggests to go long is because based on the weekly chart, price won't be overvalued until price get to and/or near the 0.9200 level.
This post is my personal opinion. I’m not a financial advisor, this isn't financial advise. Do your own research before making investment decisions.

Posted Using LeoFinance