Top And Worst Asset Performers For The Week Of 5/4/20

Intermarket analysis is a powerful tool that gives traders/investors a macro predictive direction of stocks, bonds, commodities and currencies. Intermarket analysis states that all asset classes are interrelated and that you can’t definitively determine the direction of one asset class without examining the other asset classes.
There are several key relationships that bind these four markets together. These relationships include:
The INVERSE relationship between commodities and bonds.
The INVERSE relationship between bonds and stocks.
The POSITIVE relationship between stocks and commodities.
The INVERSE relationship between the US Dollar and commodities.
The overall goal of the intermarket analysis is to identify top performers or the markets that are outperforming others. With all that said, the top and worst performers from this past week are the following:
Top Performers
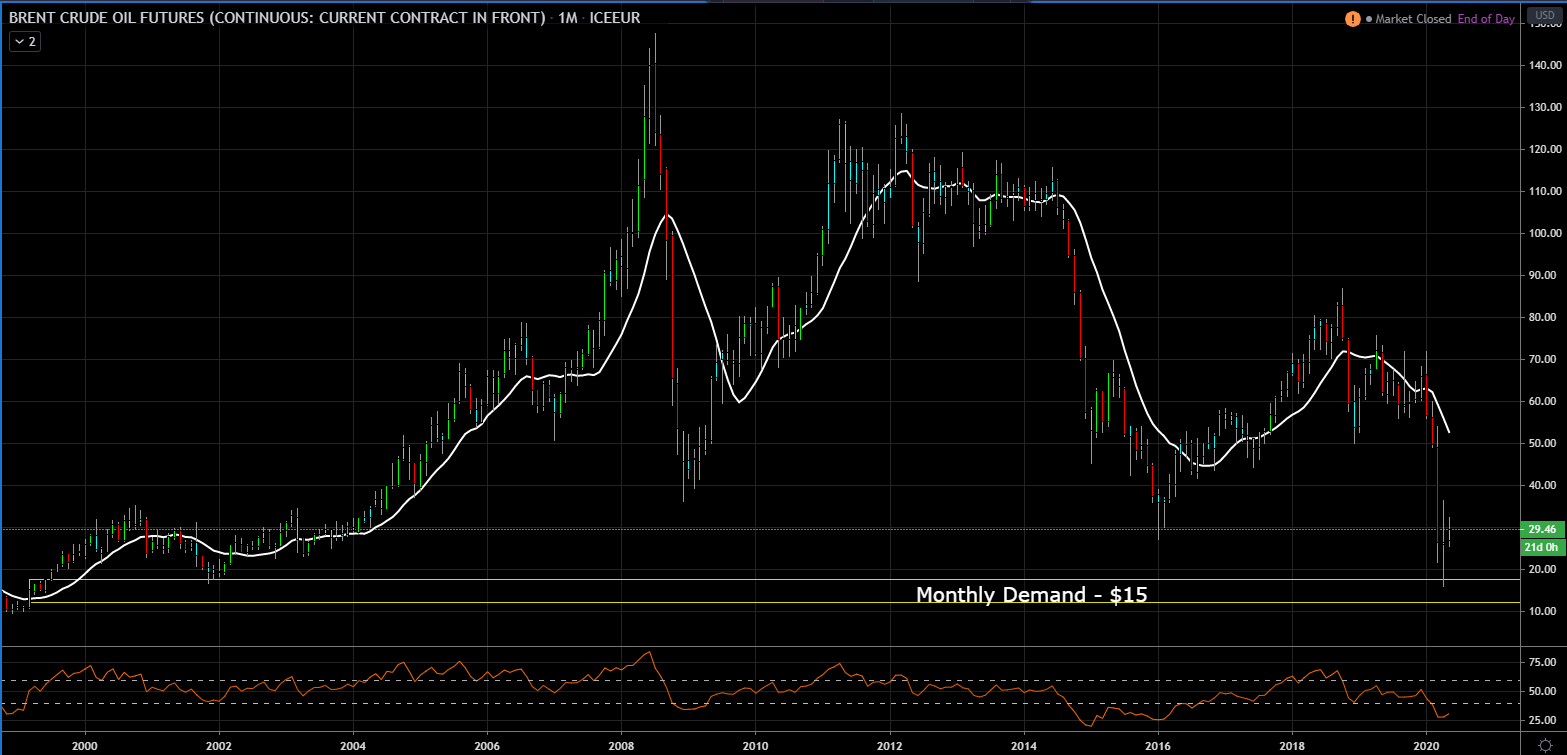
Crude Oil WTI: +25.23%
Last week, we saw oil bottoming out after price went negative the previous week. Last week also marked the official start date for production cuts under the recent OPEC agreement. Oil has risen for the 2nd week as the thought is the worst of the demand loss is behind us.
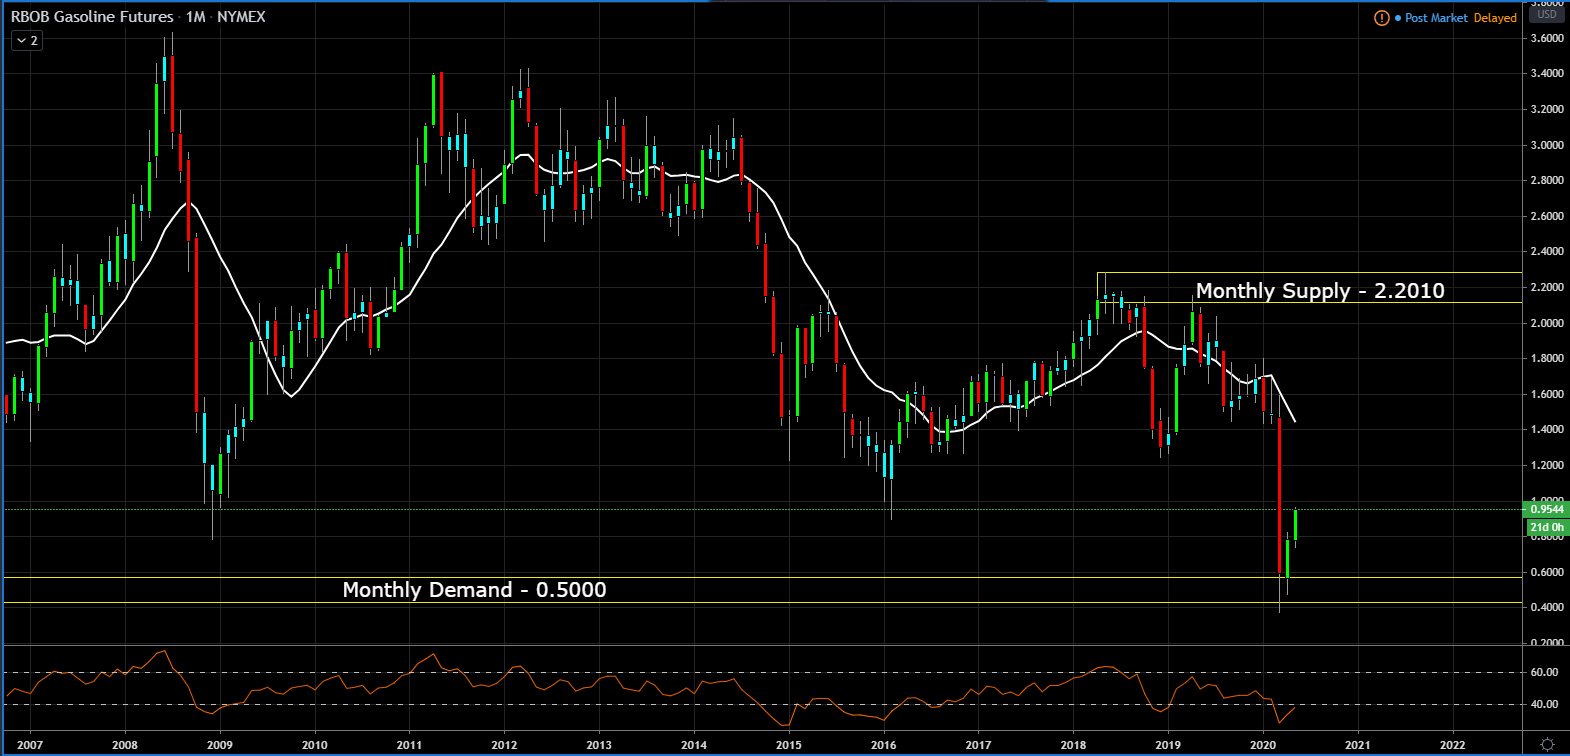
Gasoline RBOB: +24.64%
Crude Oil Brent: +17.32%
Worst Performers
Natural Gas: -3.33%
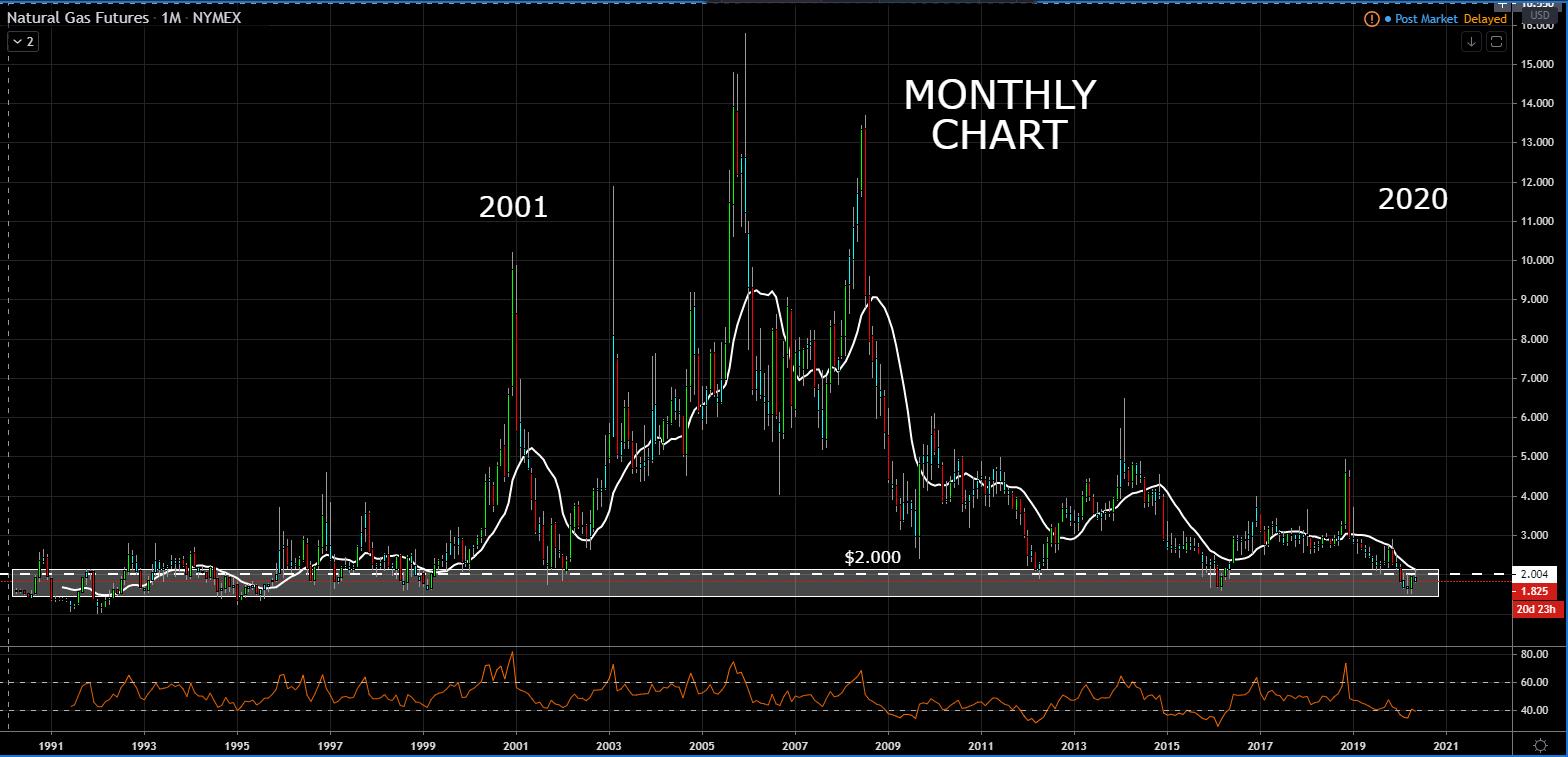
Before the virus hit, the United States was the number one natural gas producer in the world. That made U.S. natural gas prices among the cheapest around the globe. And natural gas dominance opened the door to natural gas exports, once thought to be impossible a decade ago because before the "shale revolution."
Low natural gas price was an invitation to factories that wanted to access cheap natural gas. That created jobs in the United States and helped U.S. factories prosper. Yet after the COVID-19 economic shocks, everything changed. The shutdown of economies in Europe and Asia reduced the demand for natural gas. So supplies in those countries started to build. In the United States, a pullback in production made U.S. gas more expensive than it is overseas. In fact, it is far cheaper to import natural gas than it is to use our vast supply.
Sugar #11: -6.20%
S&P 500 VIX: -14.59%
The VIX measures the volatility over the last 30 days on the S&P 500. Also known, as the fear gauge, VIX values greater than 30 represent risk off trading environments and VIX values less than 20 represent calm Markets.
Despite unheard of 20 million jobs lost in the month of April, Jeremy Siegel, professor of finance at the University of Pennsylvania’s Wharton School of Business, told CNBC, "we’ve seen the lows in March’ for the stock market and we will never see those lows again.
That all, but sums up the sentiment on Wall Street right about now.
This post is my personal opinion. I’m not a financial advisor, this isn't financial advise. Do your own research before making investment decisions.

Posted Using LeoFinance