Top And Worst Asset Performers For The Week Of 4/27/20

Intermarket analysis is a powerful tool that gives traders/investors a macro predictive direction of stocks, bonds, commodities and currencies. Intermarket analysis states that all asset classes are interrelated and that you can’t definitively determine the direction of one asset class without examining the other asset classes.
There are several key relationships that bind these four markets together. These relationships include:
The INVERSE relationship between commodities and bonds.
The INVERSE relationship between bonds and stocks.
The POSITIVE relationship between stocks and commodities.
The INVERSE relationship between the US Dollar and commodities.
The overall goal of the intermarket analysis is to identify top performers or the markets that are outperforming others. With all that said, the top and worst performers from this past week are the following:
Top Performers
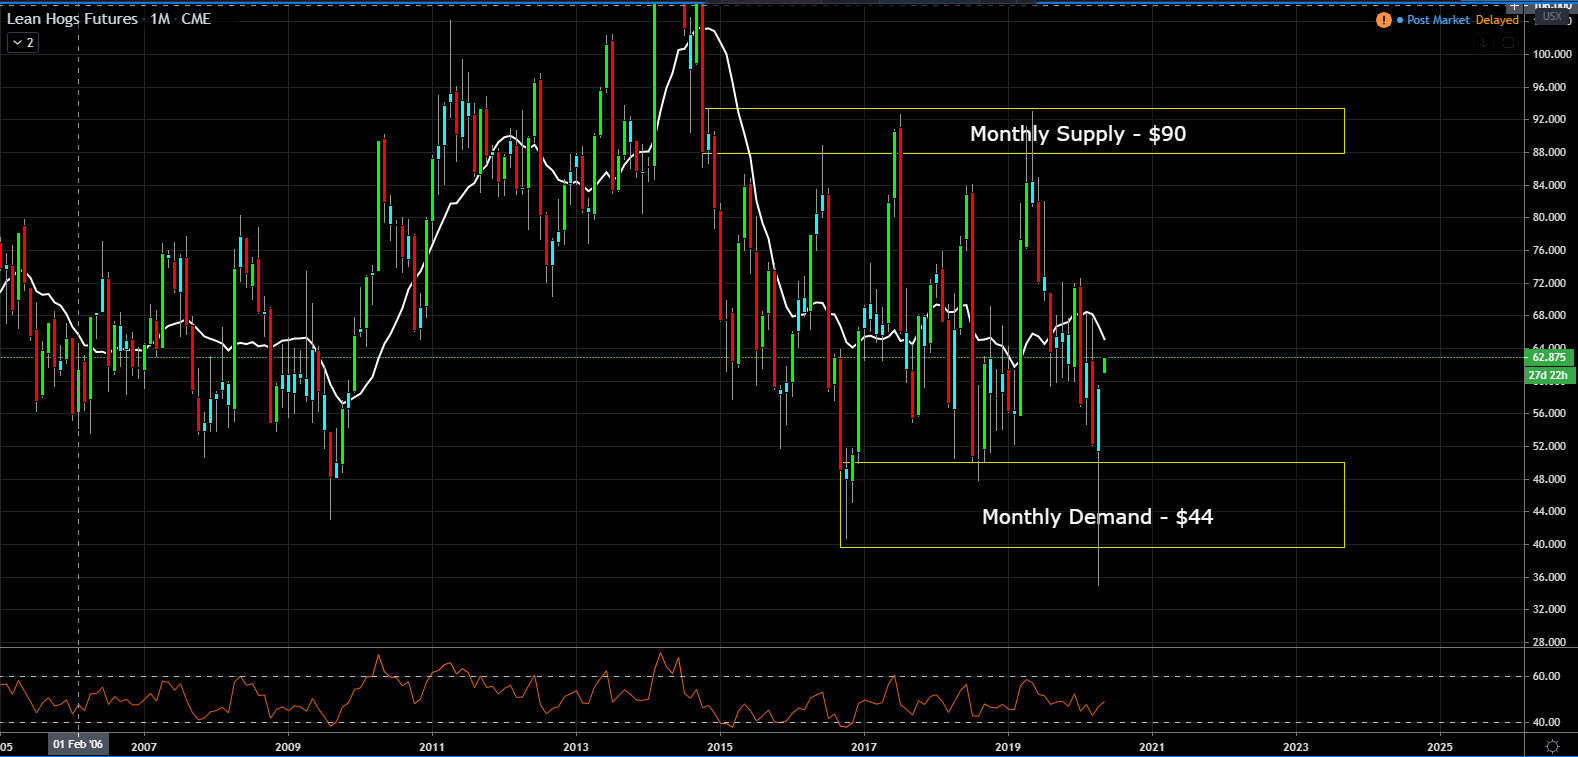
Lean Hogs: +19.70%
According to the US Department of Agriculture, the US hog slaughter totalled 1.986 million head in the week ended 25 April vs. a weekly total of nearly 2.8 million head in late March. More than 150 of America’s largest meat processing plants operate in counties where the rate of coronavirus infection is already among the nation’s highest. Tyson Foods said it will indefinitely suspend operations at its largest U.S. pork plant to contain the spread of the coronavirus...that as until President Trump slapped the meat industry with Defense Production Act stating that meat processing plants are essential to the food supply.
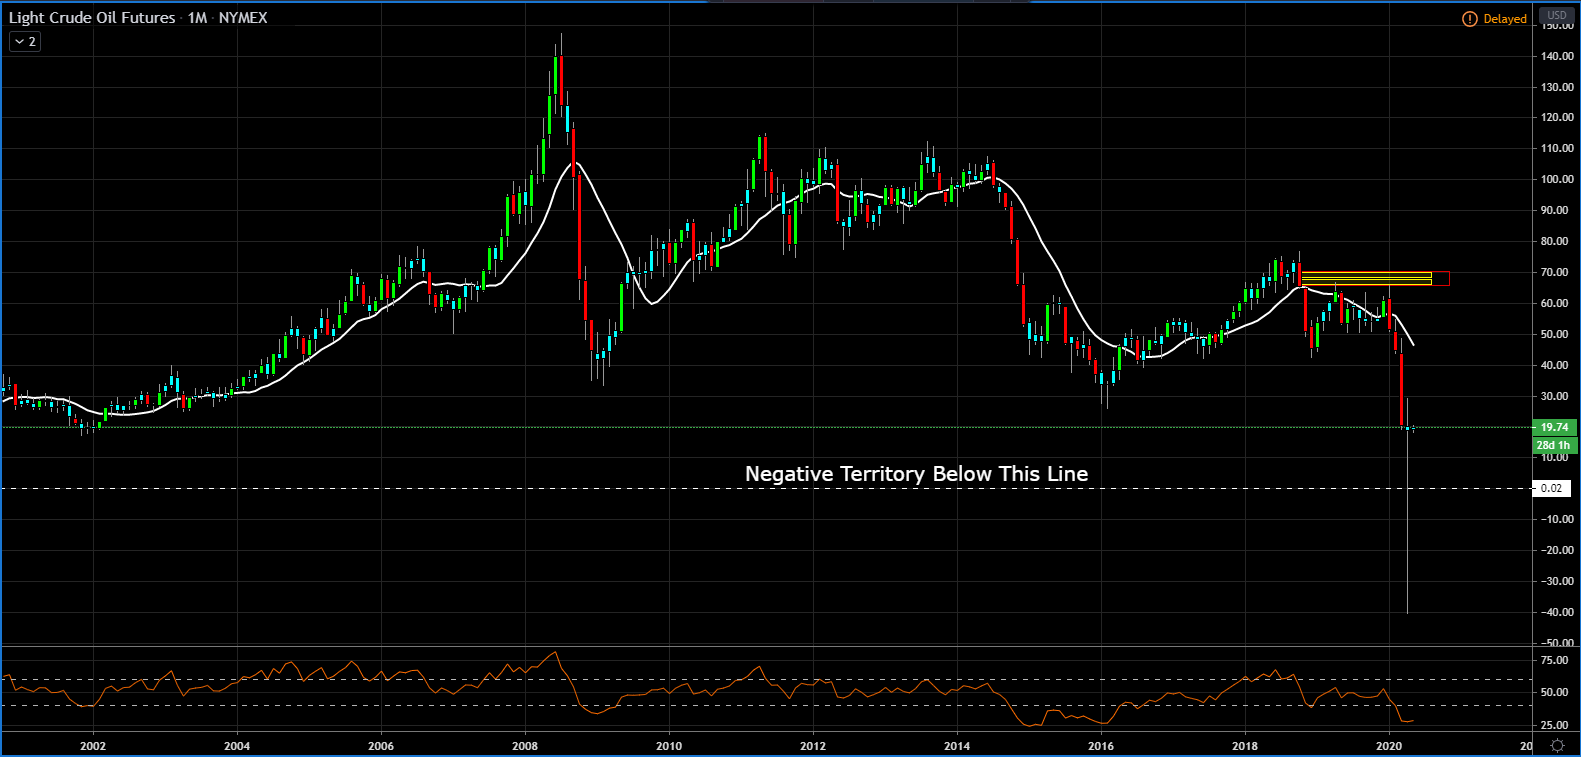
Crude Oil WTI: +16.77%
WTI crude oil traded went negative for the first time ever a couple last week. So was that the bottom in oil, possibly. Since that time, oil has steady risen this this week finished up for the first time in four weeks. In addition, today marked the official start date for production cuts under the recent OPEC agreement.
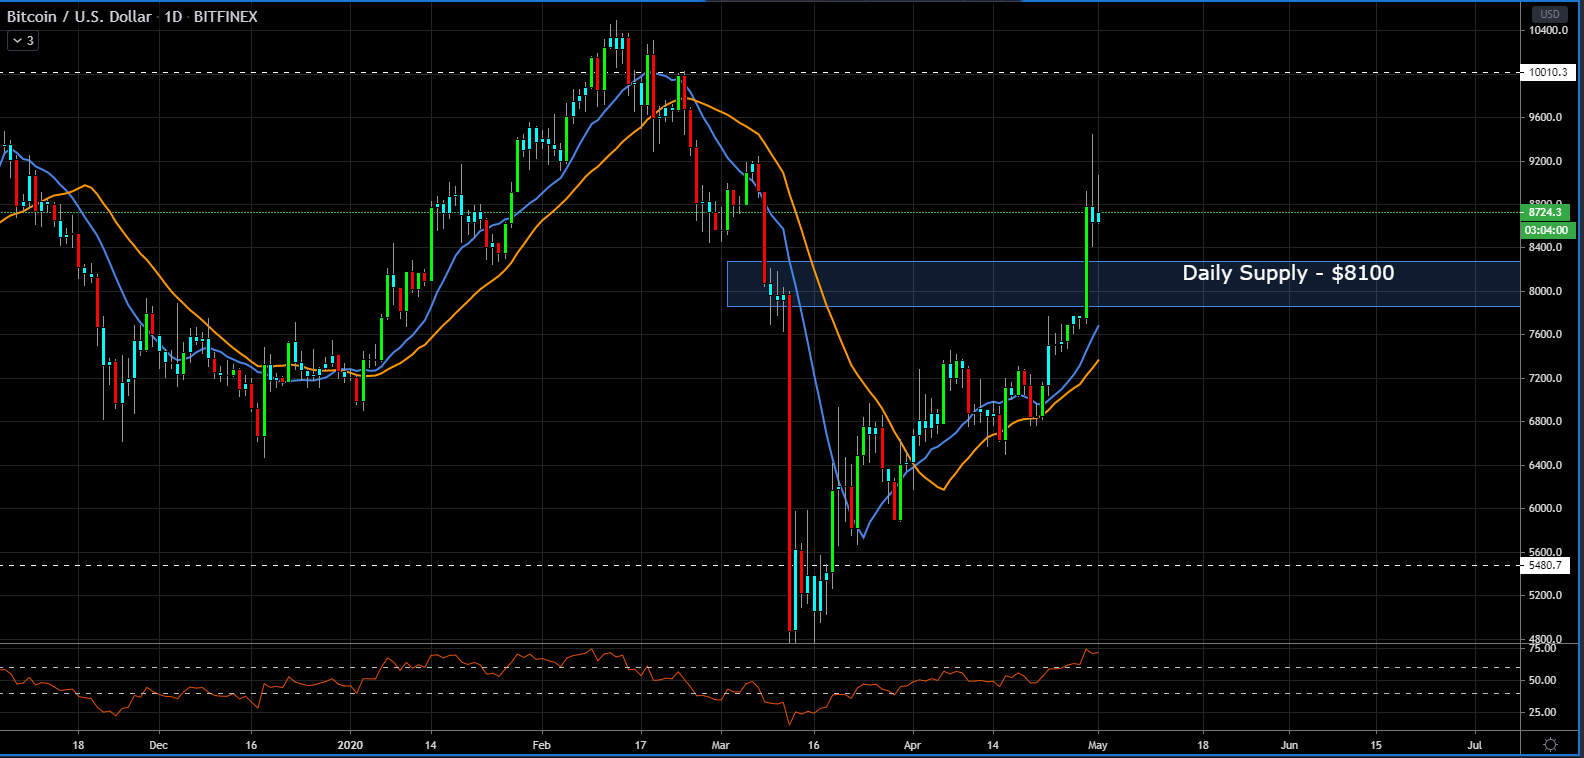
Bitcoin CME Futures: +16.39%
Mid-week, the price of Bitcoin increased from $7,700, breached the daily supply at $8,000 and touched $9,500. Price are back under $9,000, but this might be momentary as the halving event is just under three weeks away. Bitcoin Halving is where the number of generated Bitcoin rewards per block is cut in half making the supply and demand of bitcoin a bit more imbalanced. Meaning the less Bitcoin available, the more demand there is for bitcoin, thus the higher price.
Worst Performers
Gold: -1.55%

Silver: -1.85%
Palladium: -4.60%
The conspiracy theorists were out in force yesterday and should continue harping away this morning. What else could explain a 50% retracement in gold over the last couple of weeks? From a technical view, gold is now at must-hold support; if the $1,650 level in the June futures fails, the trend will reverse from long to short.
Silver has been weaker than gold but also finds itself at a must-hold level of $14.80 in the July futures. Silver finds itself at the bottom end of congestion, which should create a bounce and reverse the trend. However, we do not change until the technical levels confirm.
Platinum looks the best of the group although it is still in congestion. Platinum is in a wide trading range of $750-$850 in the July futures and can go either way from here.
This post is my personal opinion. I’m not a financial advisor, this isn't financial advise. Do your own research before making investment decisions.

Posted Using LeoFinance