Natural Gas Analysis Report - 8/20/20...Natural Gas Breaks Out
Chris Verrone of Strategas was on CNBC's "Fast Money," the other day and he thinks natural gas has more room on the upside after it broke above its multi-year downtrend. How much higher, Chris thinks price could move up to $3. Chris also likes prices going higher because of its seasonality as it usually performs well in September and October.
There are typically two seasons for the U.S. gas market: Summer (April-Oct) and Winter (November-March). Gas is injected into the ground in Summer and gas is withdrawn in Winter to meet demand that rises well above production. And based on the seasonality of natural gas, prices tend to rise from the Fall to the Winter.
Natural gas prices move higher on Wednesday ahead of Thursday’s inventory report from the Department of Energy. Expectations are for a 45 Bcf build in stockpiles according to survey provider Estimize. This follows last week’s larger than expected build of 58 Bcf. The weather remains warmer than normal in the southwest part of the US which is increasing cooling demand.
There are currently three storms moving across the Atlantic Ocean and it appears that the new trajectory has them entering the Caribbean Sea and into the Gulf of Mexico. This could be an issue for natural gas infrastructure. The first disturbance has a 40-60% chance of turning into a tropical cyclone. The second now has a 90% chance of becoming a tropical cyclone. The last, which is just coming off the coast of Africa has less than a 20% chance of becoming a tropical cyclone.
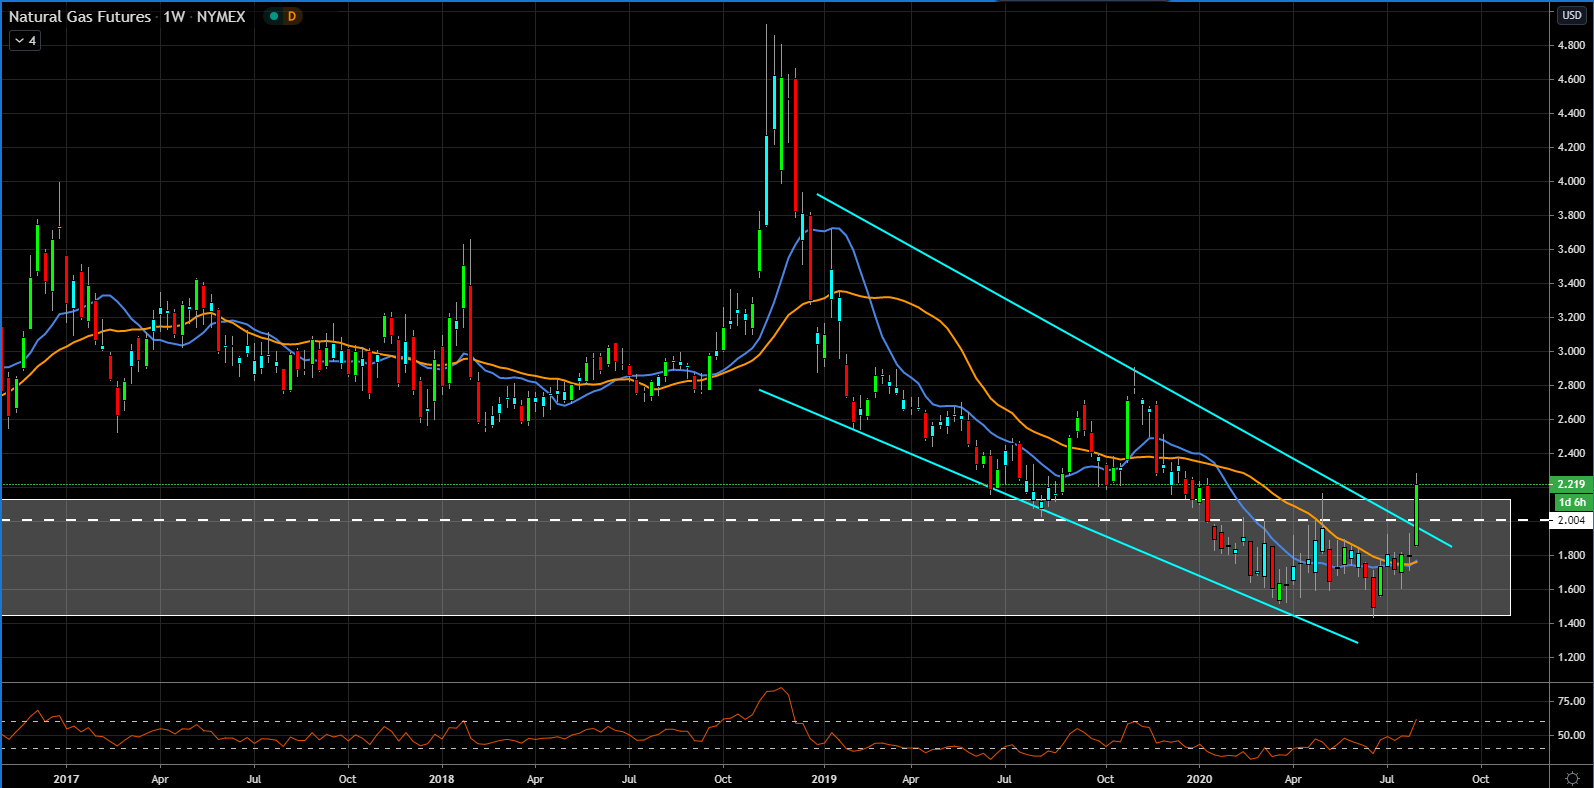
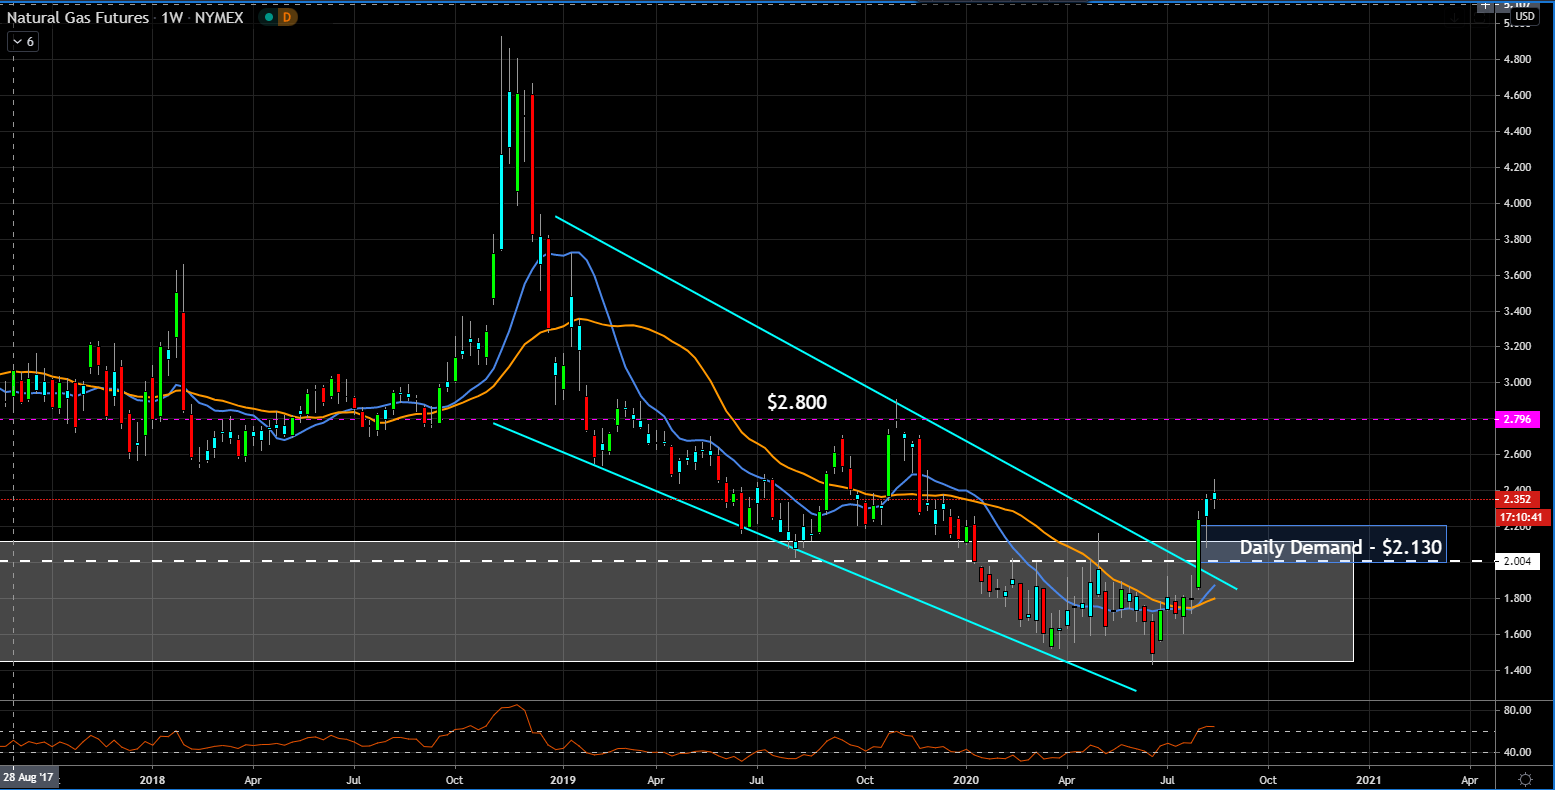
A couple of weeks ago, it appeared price was attempting to break out, but the chart suggested price was still basing and to wait for some type of confirmation before going long. But as you can see on the weekly chart, price formed a double bottom. A double bottom is a technical chart pattern and indicates a reversal is taking place.
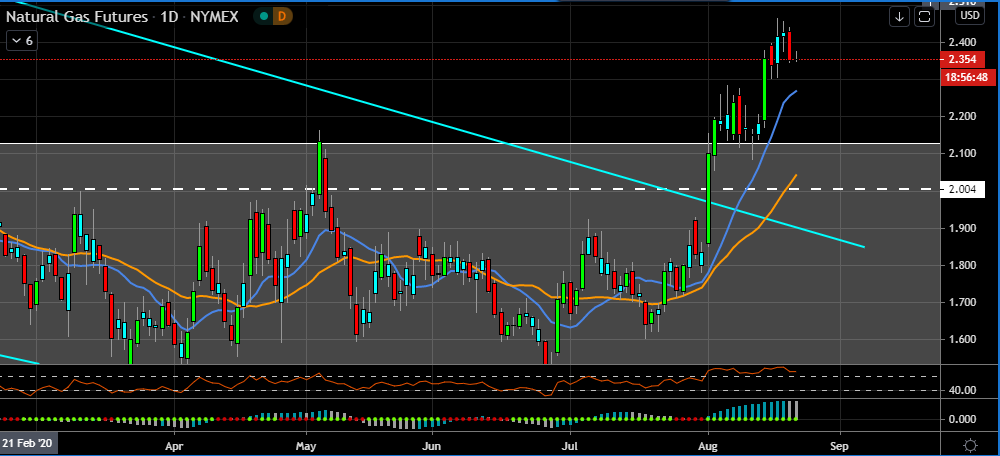
After some basing, price has finally breakout on the daily chart.
That basing now serves as demand.
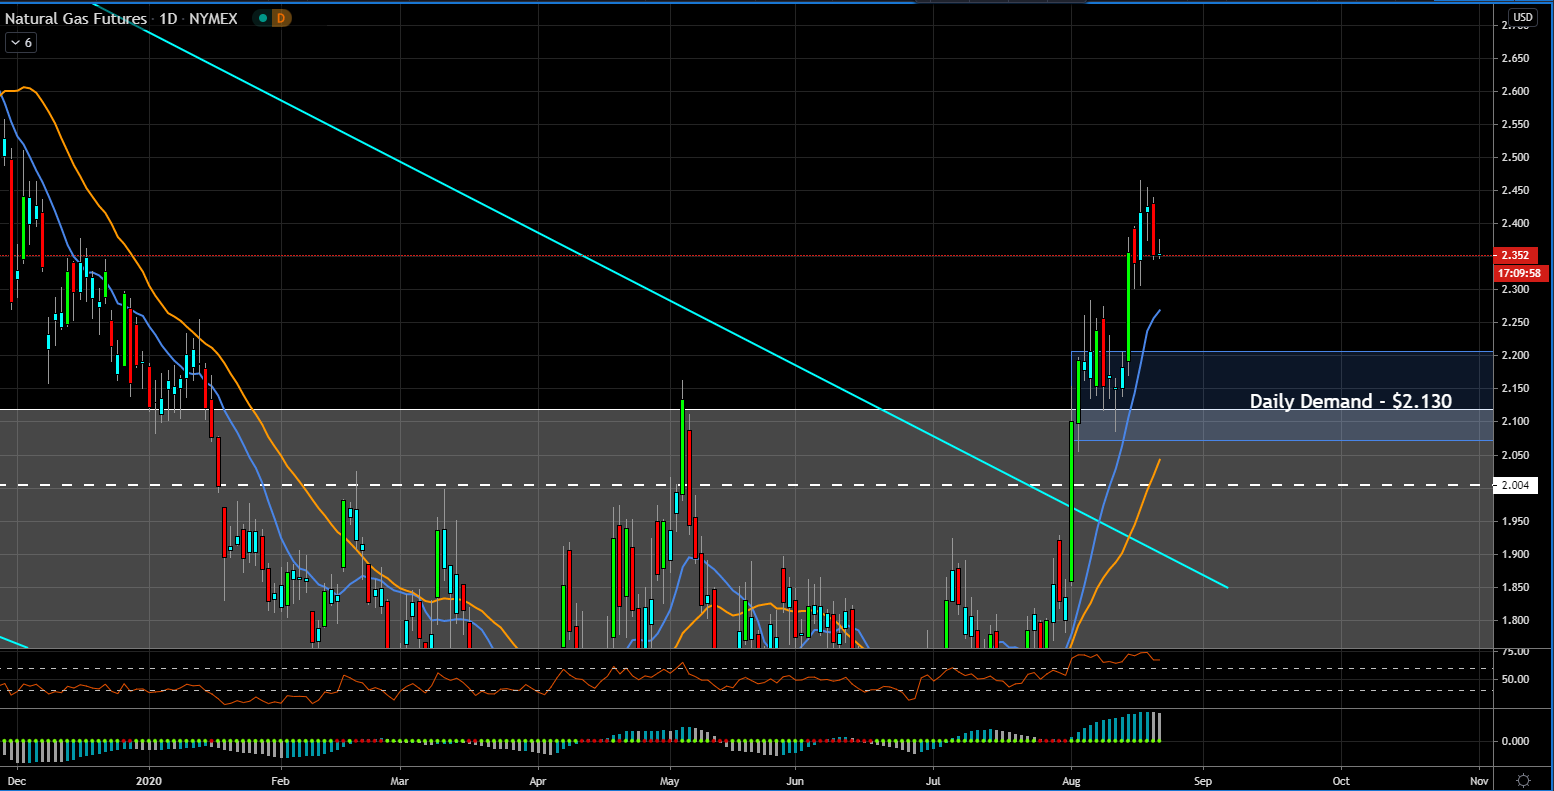
Thus, the chart suggest to buy price on a pull back to the daily demand with a first target at $2.80.
This post is my personal opinion. I’m not a financial advisor, this isn't financial advise. Do your own research before making investment decisions.

Posted Using LeoFinance