Campbell Harvey…The Father Of The Inverted Yield Curve Is Saying People Are Forgetting About The Dot Com Bubble

Campbell R. Harvey is Professor of Finance at the Fuqua School of Business, Duke University and a Research Associate of the National Bureau of Economic Research in Cambridge, Massachusetts. He served as President of the American Finance Association in 2016.
Professor Harvey obtained his doctorate at the University of Chicago in business finance. He has served on the faculties of the Stockholm School of Economics, the Helsinki School of Economics, and the Booth School of Business at the University of Chicago. He has also been a visiting scholar at the Board of Governors of the Federal Reserve System. He was awarded an honorary doctorate from Svenska Handelshögskolan in Helsinki. He is a Fellow of the American Finance Association.
Harvey serves Partner and Senior Advisor at Research Affiliates, LLC who oversees over $200 billion in client funds as well as Investment Strategy Advisor to the Man Group plc, the world’s largest, publicly listed, global hedge fund provider. Harvey is also known has the father of the inverted yield curve.
“I am afraid the market is wearing rose-colored glasses right now,” said Campbell Harvey, a finance professor at Duke University who is particularly concerned about so-called growth stocks that include tech companies like Amazon and Microsoft. “Unfortunately, many young investors don’t remember what happened 20 years ago when the tech bubble burst.”
The economy has already been hit with structural damage, as many good small- and medium-sized business have disappeared. Underscoring the carnage, more than 20 million people are receiving US government assistance—up from about 1.5 million a year ago. Like most countries, the US is racking up a debt load unseen outside of wartime, which will either have to be paid back through higher taxes or whittled down with higher inflation, says Harvey, who pioneered a way to forecast recessions by observing the yield curve, which is the gap between short-term and long-term Treasury bond yields.
The term yield curve refers to the relationship between the short- and long-term interest rates of fixed-income securities issued by the U.S. Treasury. The financial theme in 2019 has been the inverted yield curve. Why is it so important…it’s only predicted the 5 or 6 recessions, meaning it has given no false signals going back 50 years.
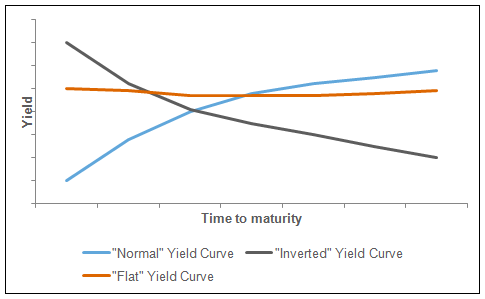
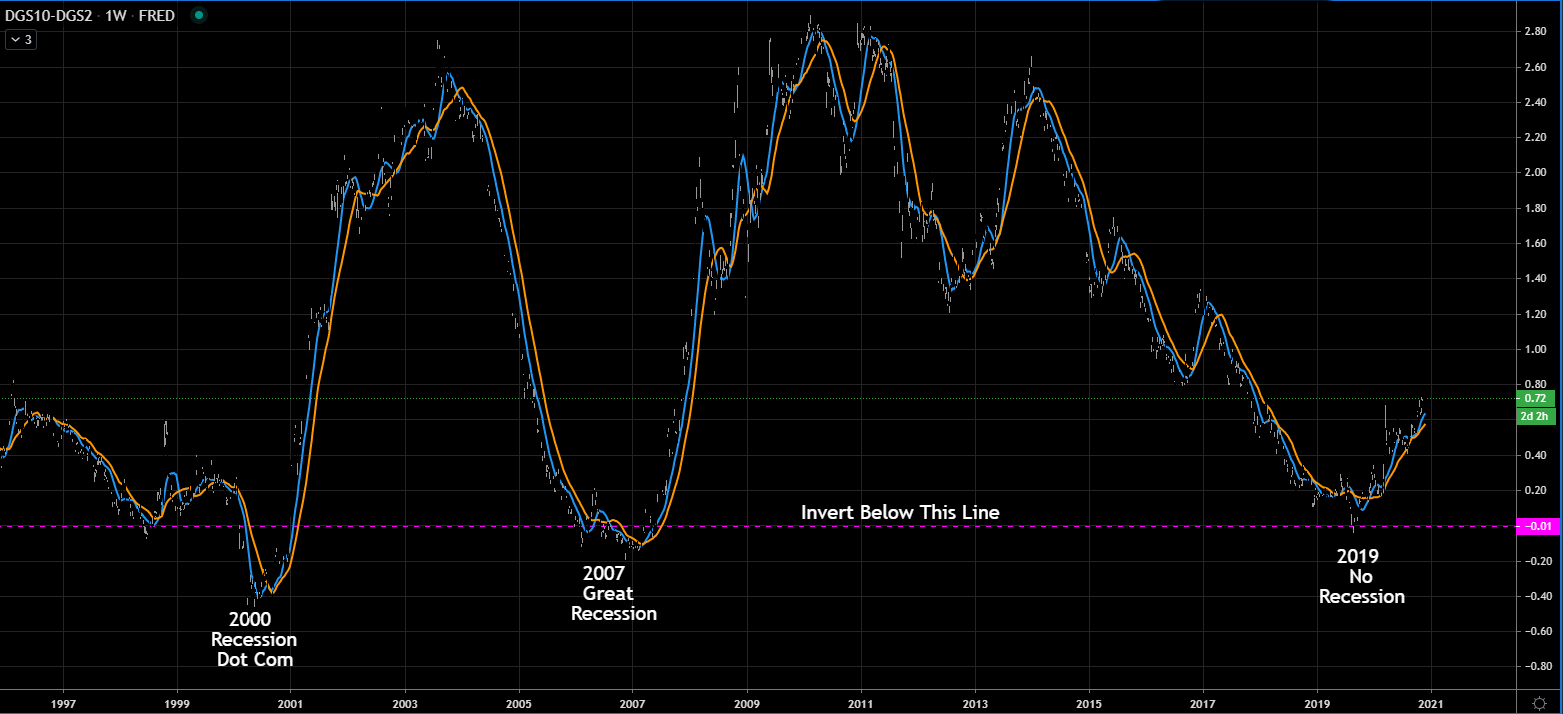
The technical definition of a recession is defined as two consecutive quarters of negative GDP growth. But when that happens, it will be too late. The stock market tops out and begins to decline before the economy rolls over. This is the reason why the inverted yield curve is so powerful, it’s a leading indicator and will give you forewarning to reposition your portfolio for tougher times. We seen an inverted yield curve in 2000 and 2007. The yield curve wet its feet in negative territory in Aug of 2019, but it was just for a hot second. As of now, there is no sign of a equity markets rolling over, so 2021 appears to be shaping up to be a better year than 2020.
This post is my personal opinion. I’m not a financial advisor, this isn't financial advise. Do your own research before making investment decisions.
Posted Using LeoFinance Beta
I still find it fascinating that the stock markets around the world have remained relatively strong, despite all that has gone on this year. How much do you think @rollandthomas that this is a result of central banks pumping trillions in to the system. Has the US FED been directly buying equities to prop up the market? I remember seeing reports that they were buying ETF's
Posted Using LeoFinance Beta
@jk6276 it's all due to the US feds...on the lastest leo podcast Neal talks about this towards the end podcast...interesting perspective backed by hard facts.
Posted Using LeoFinance Beta
Very nice piece on this man, and this is a gold nugget:
I am think of blue chip dividend paying stocks must have consumers goods like Coca-Cola, ATT, JNJ, and perhaps some nursing home stocks which seem recession proof. What ares will you move your portfolio to the weather the coming storm?
Posted Using LeoFinance Beta
I'm buying Bitcoin as a hedge :)
Posted Using LeoFinance Beta
2020 is by far the most difficult year for me. At the office I see many adjacent spaces empty and streets in downtown not even 50% full compare to a normal weekday. Yet I chart prices and expect them to move higher base on technicals. Truth is I do not think this is sustainable into 2021 or beyond. There is something happening in the cash markets. There is still a massive pile of cash on the sideline but once that is in the market there is no more buyers. No more because everyone has bought in. Fundamentally a lot of states are short on tax revenues and federal government is holding back stimulus. This delay will inevitably cost great pain down the road. Only way out is inflation. I think government should plan on buying equities and distributing to the people. Only way to force inflation of asset prices once every dollar is spent. May seem silly but FED already promised buying corporate debt. Next level is pretty much the stock equity.
Posted Using LeoFinance Beta
Interesting thesis as the cash on the sideline will enter the Market next yr...it will be interesting to see if the US Feds continue to buy up equities to keep the Markets inflated.
Posted Using LeoFinance Beta
https://twitter.com/babyminer222/status/1332455189614301184
I like these explanations. This is an area where I need more education. I look forward to you doing Leo or WLEO one day!
Posted Using LeoFinance Beta