Trading Journal (05.23.20)
Cover image of this post shall provide you what I am leaning toward for next week. This by no means I am bullish on the economy or recovery, but stock prices in charts are providing signals that I feel are bullish for next move up.
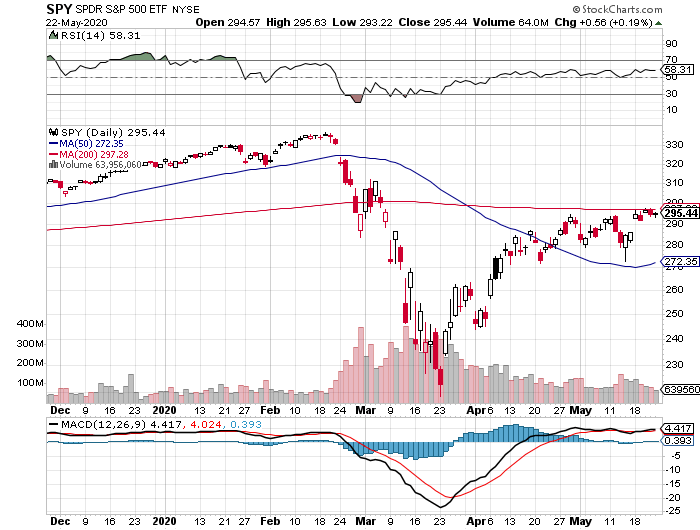
From Monday's gap up the SPY has consolidated right below the 200 day moving average. It has yet to really move since Monday so this will mean that the next big movement will come soon enough. Since there has been a lot of put options surrounding the 290s it has been quite noticeable support for SPY. On the flip side anything above 300 seems to be less popular. Rather than thinking a contrarian trade the sentiment trading here is that prices flow to the least resistance.
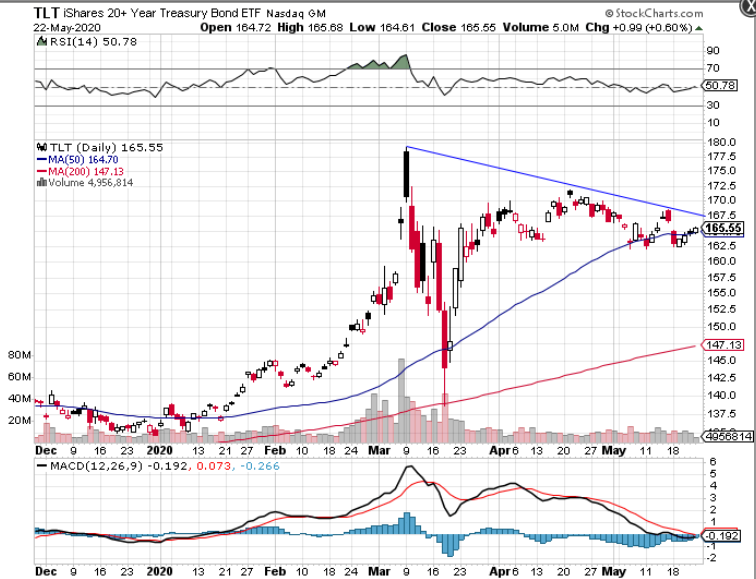
Bond market seems to be bounding off the 50 day moving average and is ready to rise with MACD turning. However 167.5 on TLT will be a resistance that needs to break in order to get out of its existing bear flag trend. TLT has been making lower highs and as it gets pressed on the 50 day moving average more and more it will likely break. Another bullish sign for stocks.
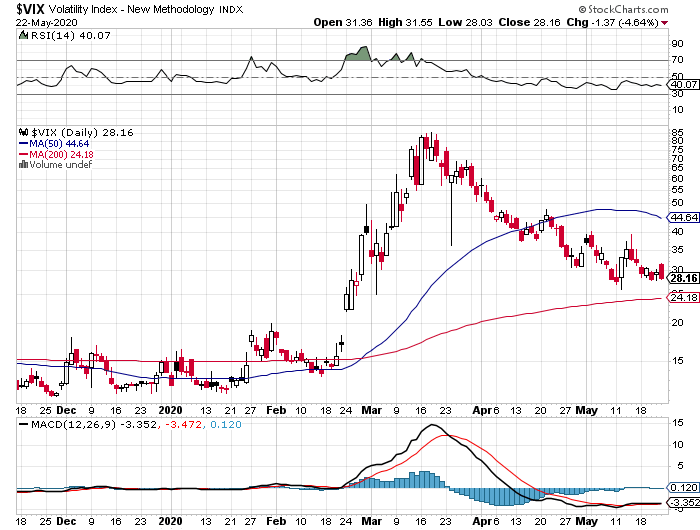
Volatility tried to perk up over the week after Monday's collapse, but even on Friday it was unable to hold its latest bounce. Although it has not raised caution is warrant since VIX has been steady near the 28-32 range. This is likely a sign that traders continue to have demand on put options either to protect their core holdings from down side or predicting stocks would go down.
Boeing Flying....
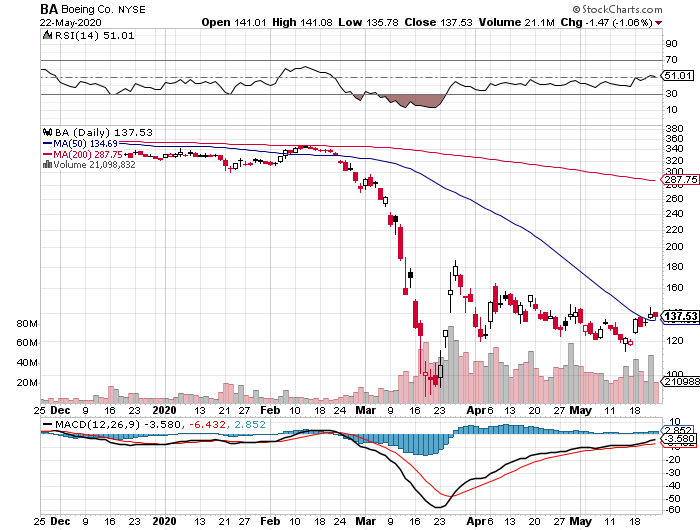
For those who follow my blog it is clear skies for Boeing. It has finally broke over its 50 day moving average. BA also retested the 50DMA on Friday and held. The MACD is rising rather than flat line therefore prices is leaning more bullish than past weeks. There is potential of this stock going higher from here and if in fact overall market rises then BA will benefit.
Dark Pool going in Bigly!
A sentiment I keep track of in trading is how the big players are playing the market and since the start of the week they have been buyers.
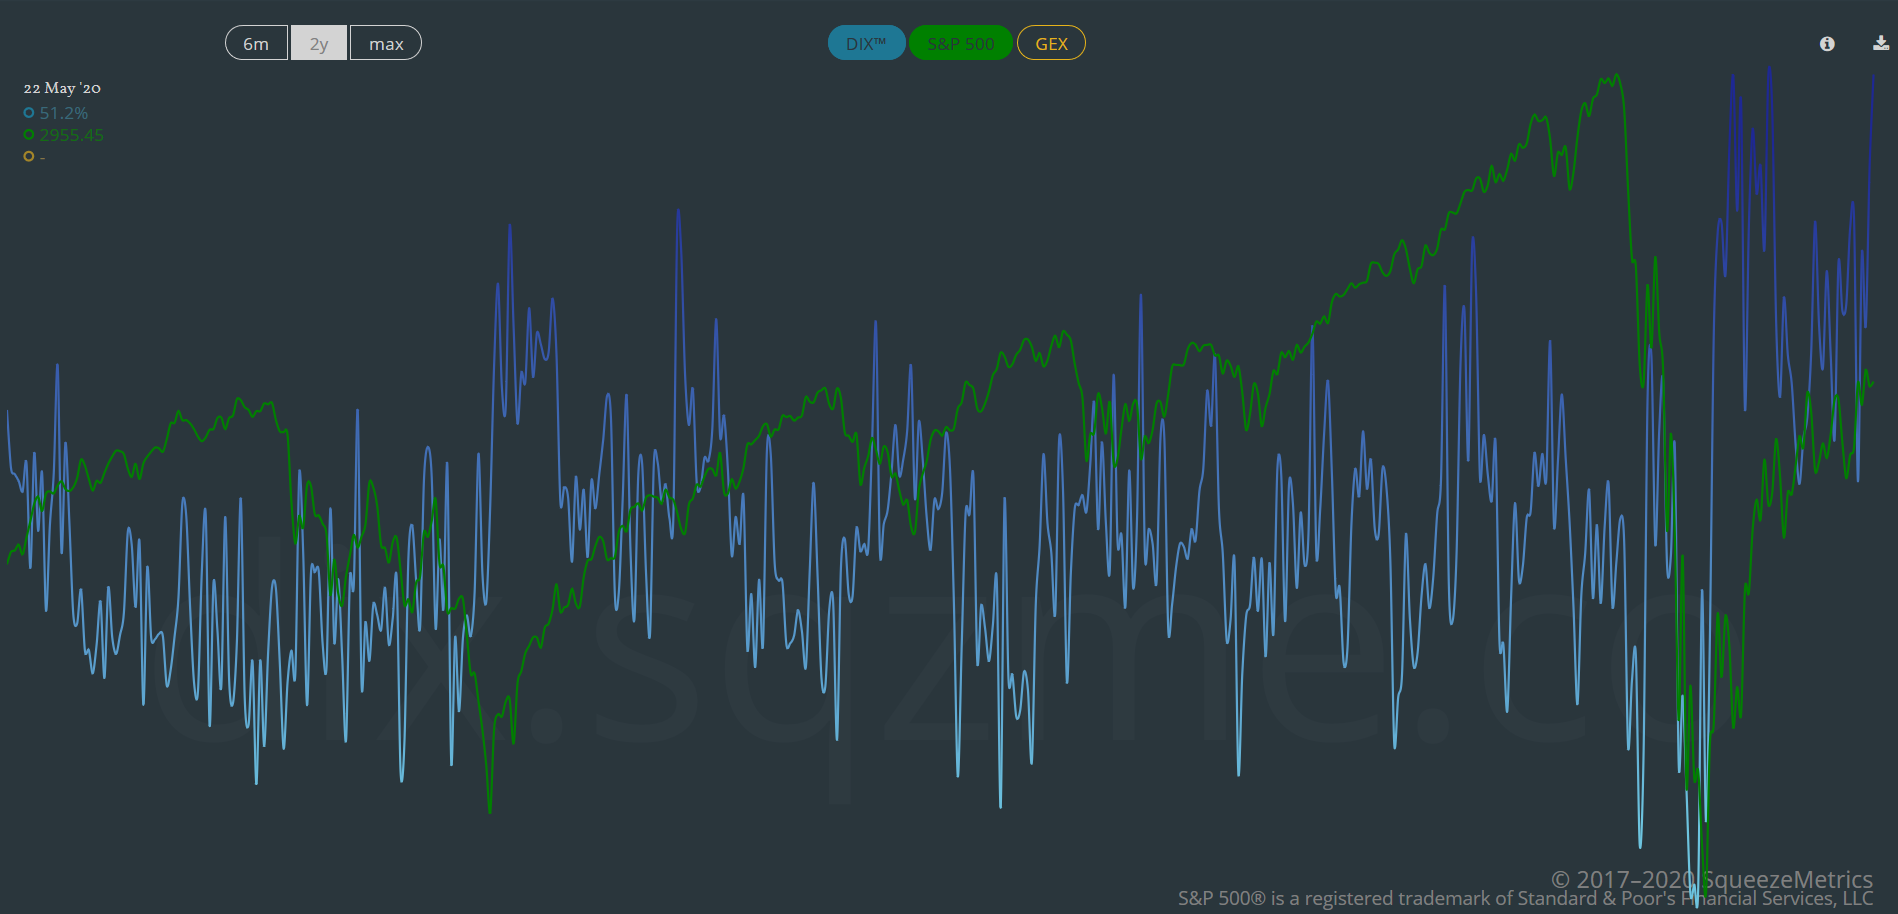
Basically a DIX under 40 will mean larger players are sellers while over 50 they are buyers. Currently as of close of Friday the DIX is at a high over 50. This is not the only signal I reference as to being bullish or bearish but definitely helps in holding my belief of the directions markets are heading. Following the big money is a slow easier going against it.
Disclaimer:
I am not a financial advisor and all this post information is for entertainment purposes only.
Posted Using LeoFinance