Charts of the Day - Trading Journal (09.15.20)
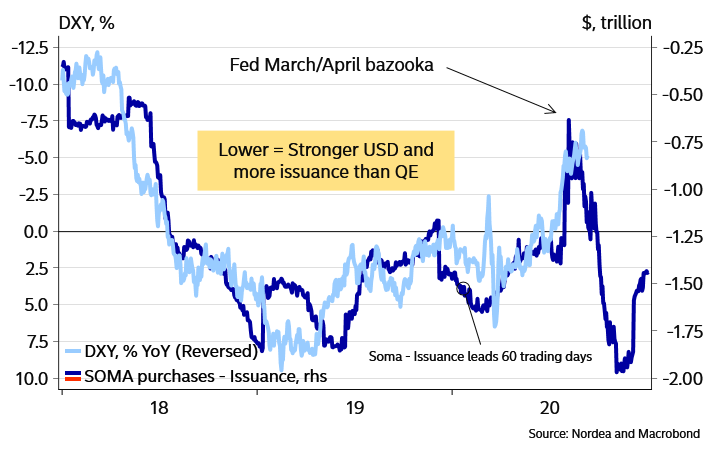
Inflation or deflation? First off there are signs that the dollar is getting stronger. $DXY if trend is followed as graph above then the dollar has a lot more room to appreciate. This will led to deflation and will not help the stock market bulls.
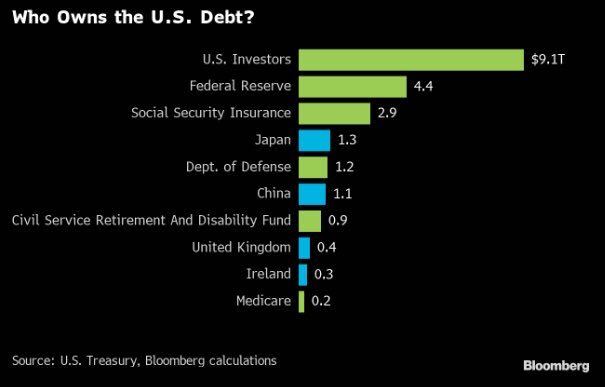
Another angle looking at inflation is the amount of debt that has ballooned in the US government spending. A majority of the debt is own by Americans and the FED. Interesting to compare how much foreign countries own US debt as now it is clearly shown here that US is not totally dependent on foreigners holding US treasuries.
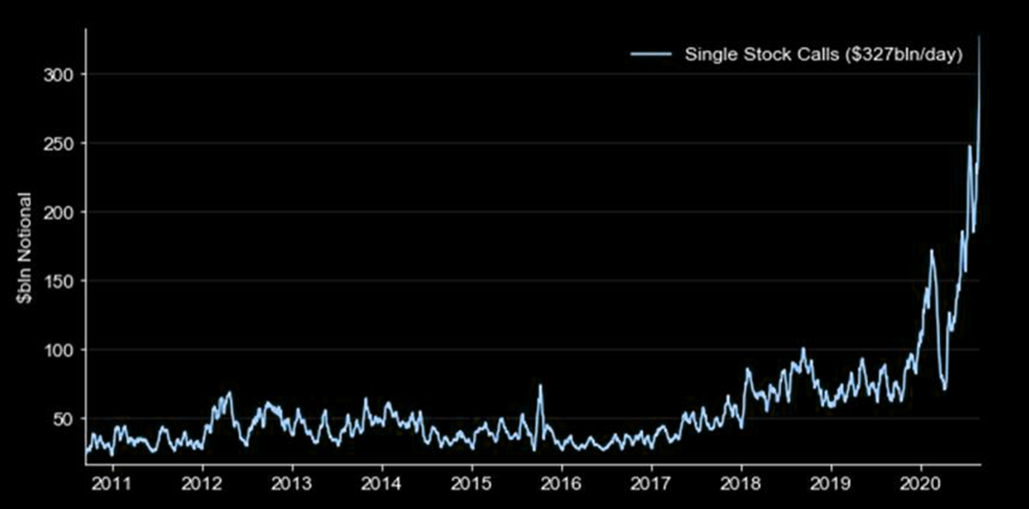
The call buying in current markets continue and currently it is at an all time high as shown in chart above. How much more can this continue to lift markets is anybody's guess. What is interesting is how high it has rose from previous years.
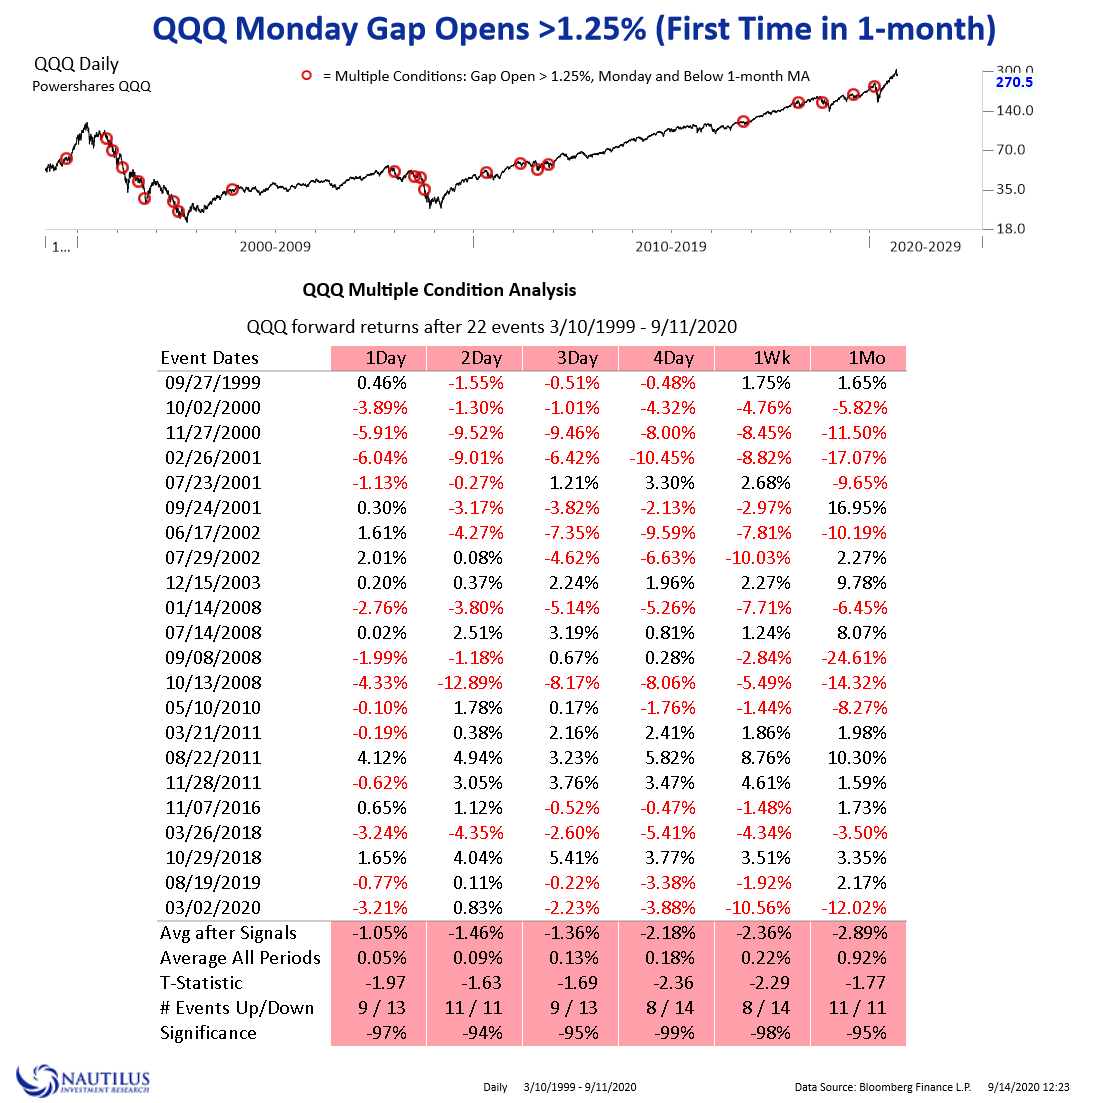
An ominous yet interesting data matrix on days tech index gap up over 1.25% on a Monday the leading future results in the days to follow. We had such an occurrence this last Monday but on a positive not the day after, Tuesday, we had a positive close. From the chart any 1 DAY numbers that turned out positive eventually lead to bigger gains down the road. We shall see how this current condition plays out.
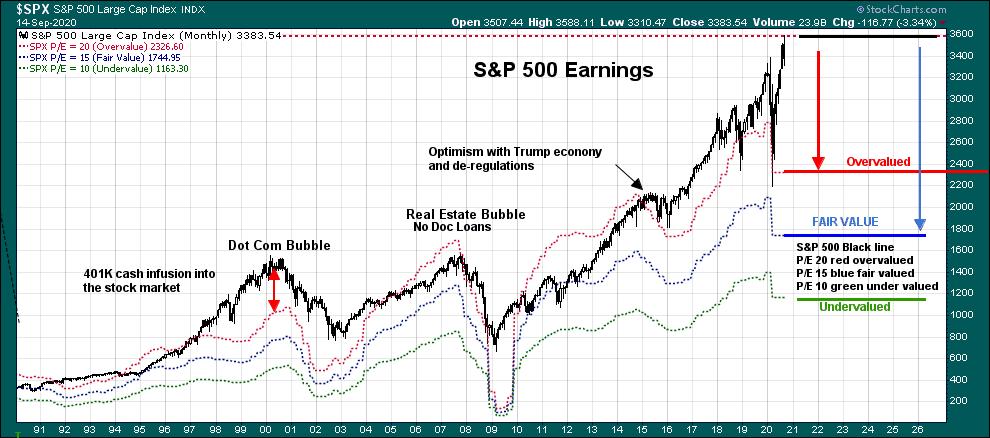
For those who feel markets are over priced the chart above is for you. It shows relative value to actual value. The actual value as in stock price is currently overvalued and there is a long way down until it reaches fair value. Right now though we can see that main street is not following wall street when it comes to price evaluations and prospects. So I am not going to hope for any stock prices to reach fair value or undervalue any time soon.
Posted Using LeoFinance