The Degen Daytrading Diaries: Bitcoin Continues in a Phase C Wyckoff Distribution
Happy Friday. With the current news about the young trader on Robinhood who committed suicide after racking up $700k in losses, be sure to never trade more than you are willing to lose, have a plan and stick to it. Trading and surfing have a lot in common – every wave is not the right set, so look specifically for your set and let the others go. Plenty of great opportunity exists for the patient.
Currently the formation is within Phase C of a Wyckoff Distribution (arguably the most volatile of all the Wyckoff Phases). The case could be made that the formation is moving into Phase D or is there already. Phase D is broadly defined as follows:
“During Phase D, price travels to or through TR support. The evidence that supply is clearly dominant increases either with a clear break of support or with a decline below the mid-point of the TR…. There are often multiple weak rallies within Phase D; these LPSYs represent excellent opportunities to initiate or add to profitable short positions.”
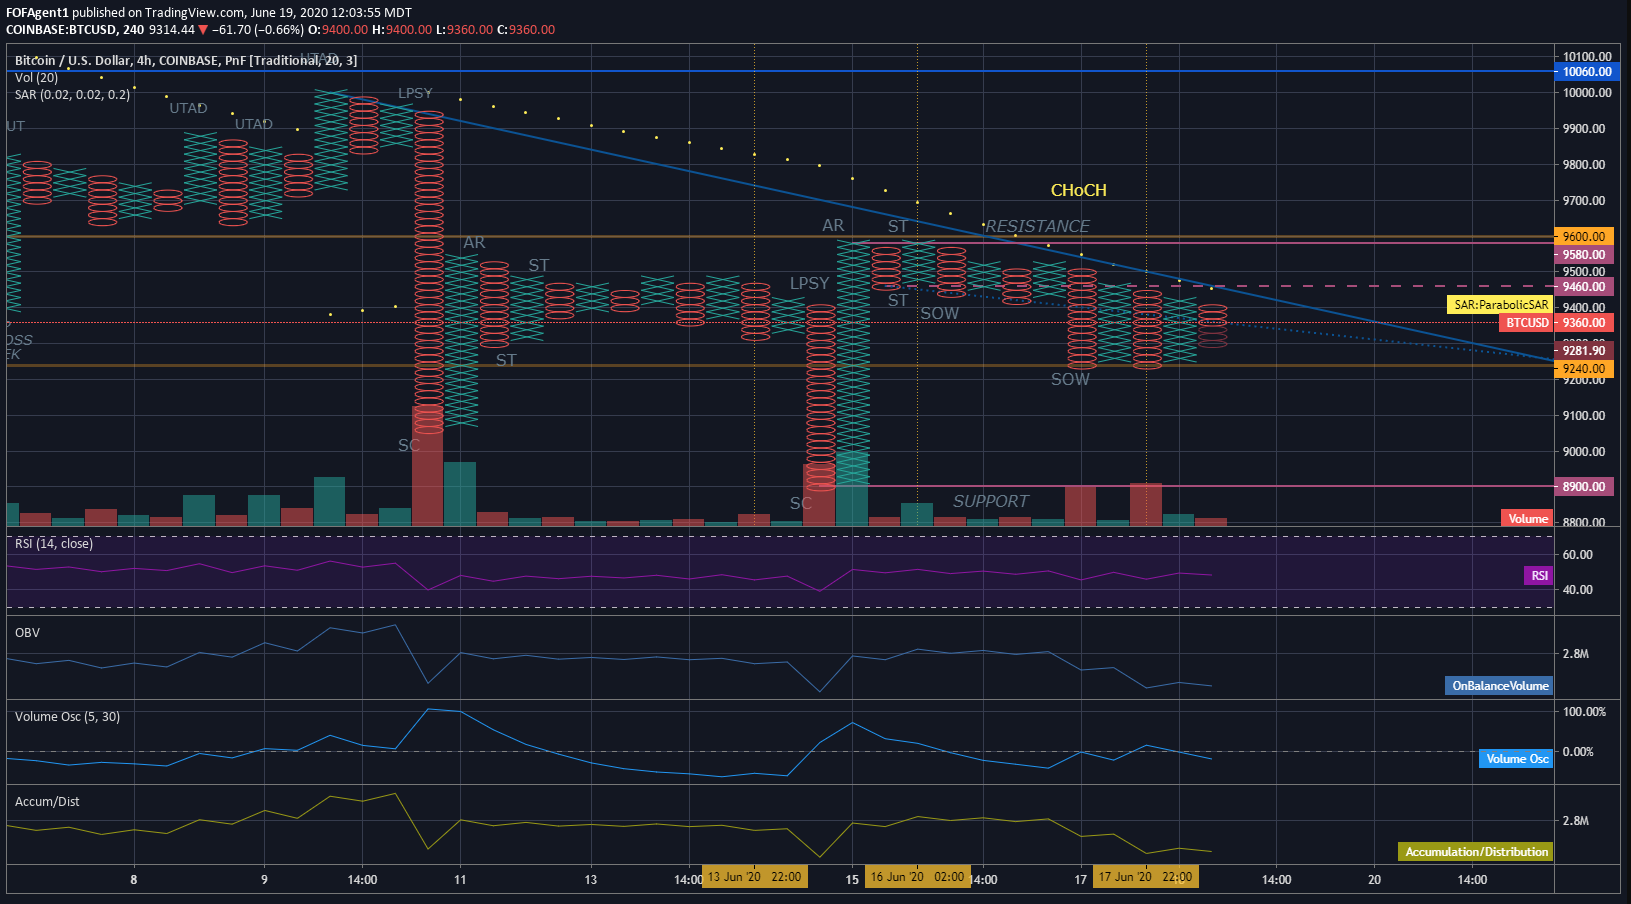
For the record, on the 4H Chart, the support zone the formation established at the outset lies between $9,460.00 and $8,900.00. Key takeaways from the current PA are:
- The formation has continued to remain constrained beneath the trend line (on the 4H Intraday) from the Upward Thrust After Distribution (UTAD) at the $10,000.00 price handle, and it appears this trend line is strong resistance and remains untested.
- The PA formed and progressed along a Bearish Support Line established with the first Sign of Weakness (SOW), which printed immediately after a Secondary Test (ST) of Resistance. The PA subsequently printed a Downward Breakdown of the Bearish Support Line on a second Sign of Weakness (SOW) and has been mired in a trade range in the middle of support since that Breakdown.
- PA spread and volume (particularly sell volume) has increased since the second Sign of Weakness (SOW) was printed on the Downward Breakdown of the Bearish Support Line to the $9,240 price handle. Since that breakdown, the Bearish Line of Support has no longer behaved as effective support for PA, and price spread has increased substantially as a result. This suggests demand has been exhausted in the higher price range.
- The Accumulation/Distribution Indicator is currently in a strong downtrend illustrating selling pressure is more prevalent in the market at the current time. A downward trend which is in congruence with falling prices points towards lower price in the near future.
- The Volume Oscillator on the 4H (-19.70%) and the 1D (-26.93%) suggesting a strong trend shift is imminent.
The current cause built into the formation from consolidation suggests a target price of $8,960.00. Always keep in mind, as consolidation continues more cause is built into the formation (much like a spring being wound and compressed before being released). Consequently, the price target will shift as consolidation continues and more cause is built in.
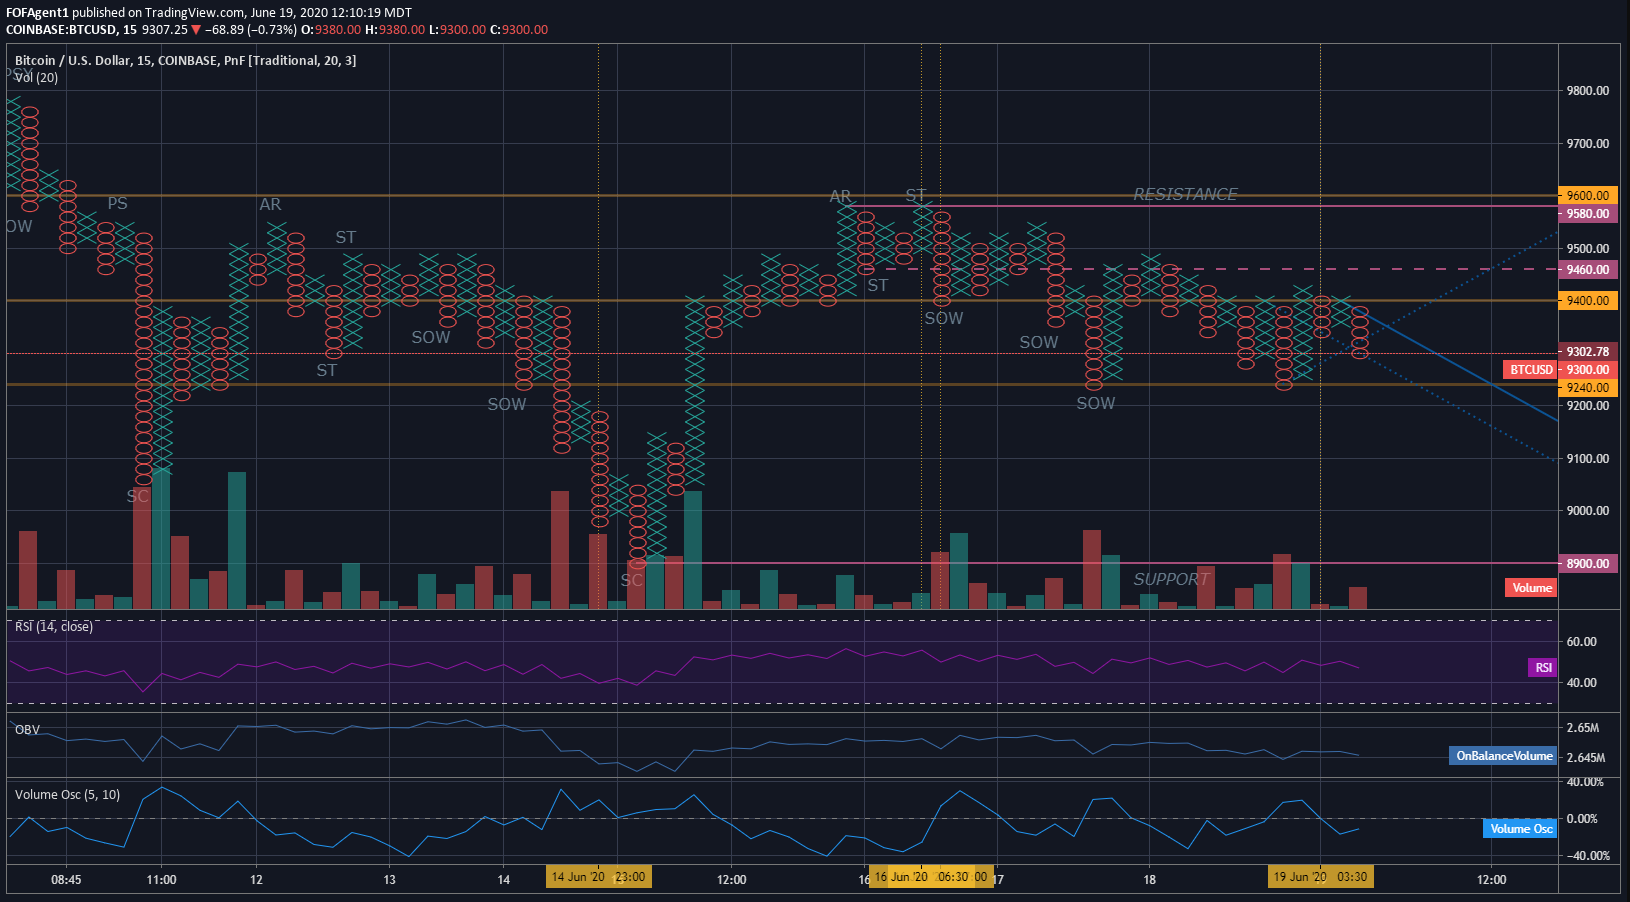
While a line of support exists at the $9,320 price handle on the 15M Intraday, my expectation is it will provide a momentary pause/resistance in downward price movement rather than strong support.
In Phase C Wyckoff Distribution volatility defines this Phase. Upward Thrusts After Distribution (UTAD) and shakeouts should be expected. Unless the formation prints Upward Thrust After Distribution (UTAD) which breaks past resistance at the $9,580 price handle, Backs Up to form a Last Point of Support (BU/LPS) at or above the resistance line and bounces, the formation still maintains a bearish bias.
Always remember this is not trading advice.
Outside of that, Happy Trading.
You can follow me and keep up to date on Tradingview as well. I trade under the handle FOFAgent1 at tradingview.com
Posted Using LeoFinance