GOLD 4hr Chart Price Analysis 13/08/2020
Hello there friends. Hope you are all having an awesome time.
Get ready for your daily dose of market insights from yours truly Lj.😃
For this segment, we will talk about the recent correction of GOLD.
We are currently looking at the daily chart for Gold.
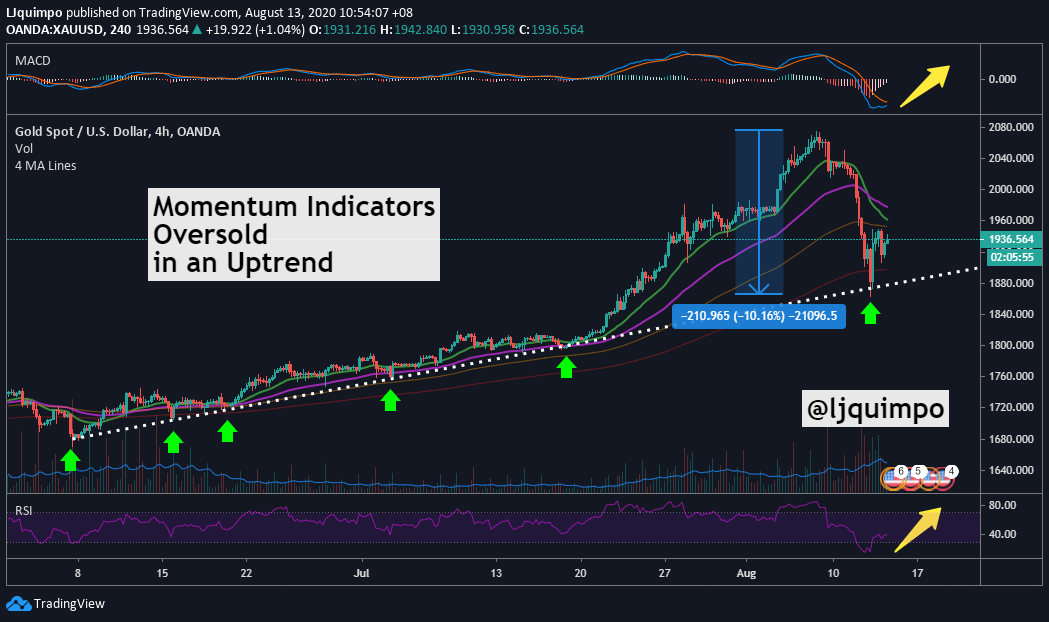
As we can see, it recently had its quite deep correction of 10% from its recent all time high of 2,076 USD.
Although this is quite a deep correction, I think its a healthy and needed correction for this asset to move forward again.
The uptrend line support is still intact. So this is indicating that many buyers are willing to step in in lower prices to support this long-term uptrend.
It had an immediate bounce when touching 1,880 USD price area and thats a good indication.
We can also see that the momentum indicators (MACD and RSI) are both already oversold.
This can be a really good opportunity for the longs to participate in an uptrending market like this.
Most of the dips in a n uptrending market is really an opportunity to participate or add to our portfolios.
As always, we should have a good plan when participating in the market.
And always have a proper risk management to preserve our capital and not blow up instantly by doing reckless things.
What do you guys think? Comment your thoughts below.
If you want some chart requests or want me to analyze some crypto or asset, just comment below and I will post it next.
Thanks!😃
Till next time guys and gals,
Cheers!! 😃
Disclaimer: This is not a financial advice and for educational purpose only.
#Investing #Trading #Gold #XAU
Posted Using LeoFinance