Daily Technical Report #4 - BTC ETH and LEO Technical Analysis | Two BTC Characters [EN-ES]
.png)
Cover created in Canva
In my last report I indicated the bullish projection that Bitcoin had, which led to the price of the asset reaching approximately $13400, at this point the price has met with clear resistance, but there is still a doubt as to what the price of Bitcoin and Ethereum could do next, all this taking into account that we are in an upward trend and the boom thanks to several fundamental factors, is making the whole crypto ecosystem even stronger and more stable.
In this report I will make an analysis of 3 of the assets that interest me the most at the moment, which are the BTC, ETH and LEO, I will talk about how I see them technically speaking and what projections I have for these 3. I want to clarify that what is said in this publication is not a direct investment recommendation and it is only my personal analysis of them, I always recommend that you make your own research before making an investment.
En mi ultimo reporte indique la proyección alcista que tenia Bitcoin, lo que llevo a que el precio del activo tocara los $13400 aproximadamente, en este punto el precio se ha encontrado con una resistencia clara, pero queda la duda que es lo que podría hacer próximamente el precio de Bitcoin y Ethereum, todo esto teniendo en cuenta que estamos en una tendencia alcista y el auge gracias a varios factores fundamentales, están haciendo que todo el ecosistema cripto sea aún más fuerte y estable.
En este reporte realizare un análisis de 3 de los activos que mas me interesan de momento, que son el
BTC, ETH y el LEO, hablare de como los veo técnicamente hablando y que proyecciones tengo para estos 3. Quiero aclarar que lo dicho en esta publicación no es una recomendación directa de inversión y solo es mi análisis personal de los mismos, recomiendo siempre que realicen su propia investigación antes de realizar una inversión.

Bitcoin 4H Technical Analysis - Two possible scenarios are presented | Análisis Técnico de Bitcoin 4H – Dos escenarios posibles se presentan

In the Bitcoin I've seen two important patterns that have formed in it, this at the moment divides my opinion of what could happen with the BTC in the short term, however, my general approach is still bullish for the medium and long term, although I hope that in the month of December or before the end of the year, the Bitcoin can have an even stronger bullish rally that may position it between the range of $15000 and $17000 respectively.
En el Bitcoin he visto dos patrones importantes que se han formado en el mismo, esto de momento dividen mi opinión de lo que pudiera pasar con el BTC en el corto plazo, sin embargo, mi enfoque general sigue siendo alcista para el mediano y largo plazo, aunque espero que en el mes de diciembre o antes del fin de año, el Bitcoin pueda tener una rally alcista aun mas fuerte que puede que lo posicione entre el rango de los $15000 y $17000 respectivamente.
Chart of 4H - "Rising Triangle" Chartist Formation | Gráfico de 4H – Formación chartista de un “Triangulo Ascendente”
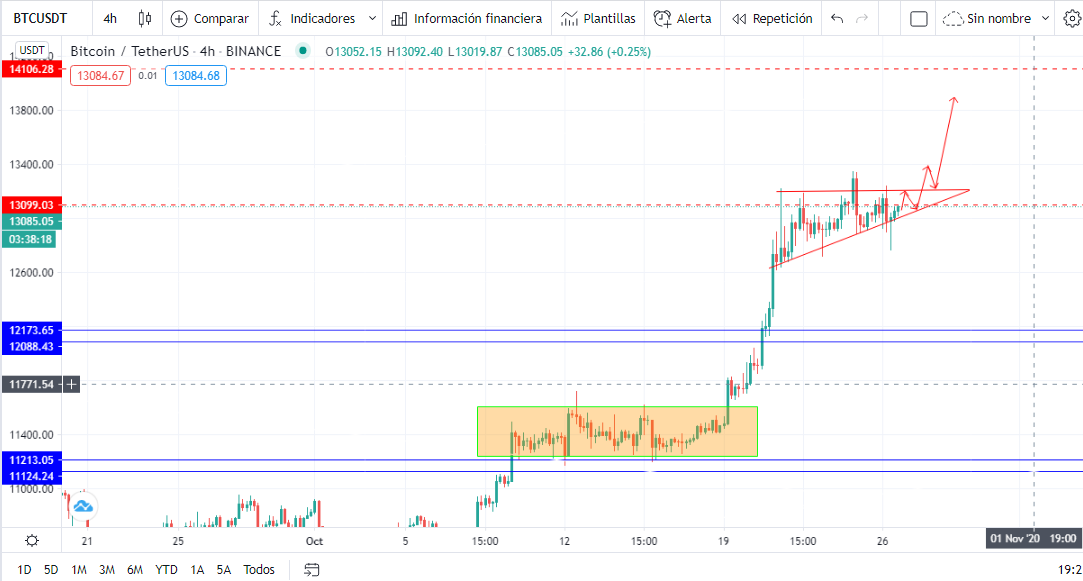
Image from the platform of TradingView
Clearly we can see in Bitcoin a chartist formation called "Ascending Triangle", where, the theory tells us that when the price hits a resistance it forms a straight line, touching more than 3 times, likewise, a perpendicular line is formed joining the lowest points of the price, which in this case are the minimums that are getting higher and higher, which makes this figure form. Now, this is a positive aspect, since this type of formation is generally a good sign that the price can break the above mentioned resistance at any time. This would put the odds up in this case.
Claramente podemos ver en Bitcoin una formación chartista llamada como “Triangulo Ascendente”, donde, la teoría nos dice que cuando el precio choca con una resistencia forma una línea recta, tocando mas de 3 veces, así mismo, se forma una línea perpendicular uniendo los puntos mas bajos del precio, que en este caso son los mínimos que se están haciendo cada vez mas altos, lo que hace que se forme dicha figura. Ahora bien, este es un aspecto positivo, ya que este tipo de formaciones son generalmente buena señal de que el precio puede romper al alza en cualquier momento dicha resistencia antes mencionada. Esto pondría las probabilidades al alza en este caso.
Chart of 4H - "Bearish Shoulder-Head-Shoulder" Formation | Gráfico de 4H – Formación de “Hombro-Cabeza-Hombro bajista”
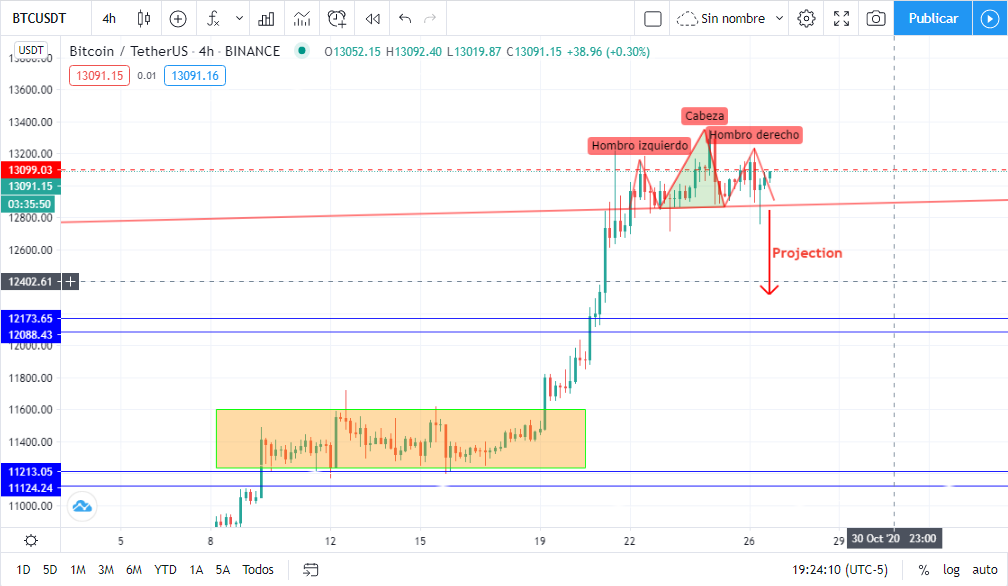
Image from the platform of TradingView
In this case the probabilities are bearish, although it seems that for the moment the figure will be invalidated, it could still fall back and break the "Neck Line", to go to the next "Support" located approximately at $12200, however, although this scenario is partially negative, it is totally rational that the price suffers a correction, so that a "Re-accumulation" range is formed to look again for new highs between $14200 and $15000.
En este caso las probabilidades son bajistas, aunque pareciera que de momento la figura fuera a invalidarse, aun pudiera retroceder y romper la “Línea de Cuello”, para dirigirse al siguiente “Soporte” ubicado aproximadamente en los $12200, sin embargo, a pesar de que este escenario es parcialmente negativo, es totalmente racional de que el precio sufra una corrección, para que se forme un rango de “Re-acumulación” para buscar nuevamente nuevos máximos entre los $14200 y los $15000.
Ethereum 4H Technical Analysis - Fibonacci Retracement | Análisis Técnico de Ethereum 4H – Retroceso de Fibonacci
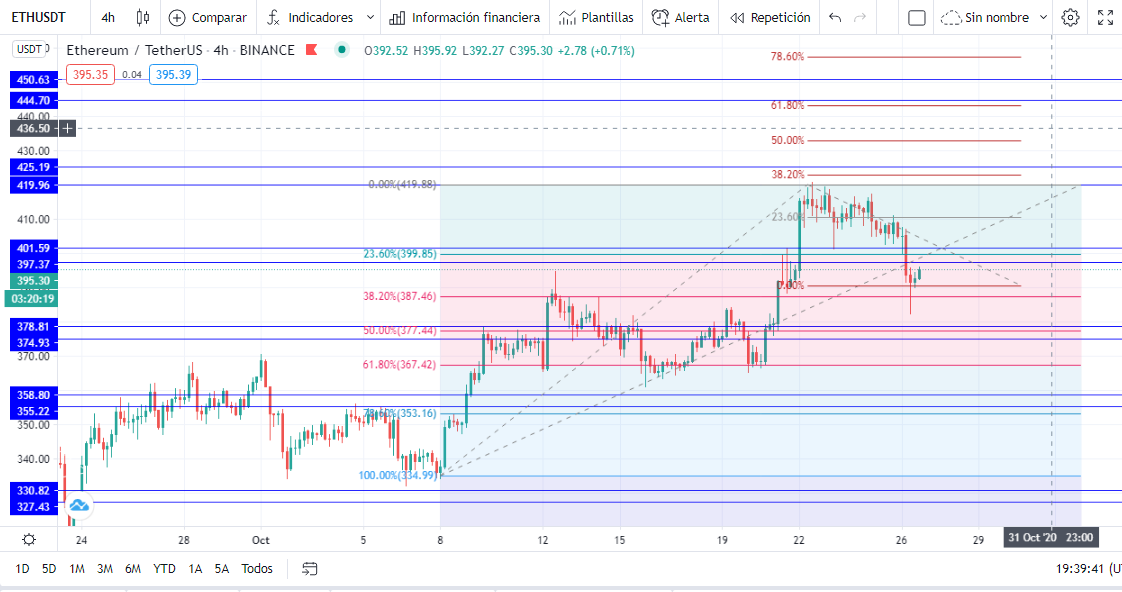
Image from the platform of TradingView
Chart of 4H | Gráfico de 4H
In the Ethereum's 4H graph, using the "Fibonacci Regressions", in this sense, tracing from the lowest point of the price at $335 and the highest point at approximately $420, the price has touched precisely 38.2%, where the theory tells us that the relevant zones for the price to undergo a change is the zone between the "38. 2% and 61.8%", called the golden zone of the Fibonacci Recession, so in that sense, this would be a good entry point into the ETH in 4H charts and as we can see the price is slowing down at that point and so far it is rising little by little.
On the other hand, tracing the "Fibonacci Extension", the targets that the price could have to follow a rising trend, are approximately at 38.2% of the Fibonacci Extensions at approximately $422. This is a type of strategy that I sometimes use in combination with other indicators that give me confirmation that there is a probability that the scenario drawn by the Fibonacci tools will occur.
En el grafico de 4H de Ethereum, utilizando los “Retrocesos de Fibonacci”, en este sentido, trazando desde el punto mínimo del precio en los $335 y el punto máximo en los $420 aproximadamente, el precio ha tocado justamente los 38,2%, donde la teoría nos dice que las zonas relevantes para que el precio sufra un cambio es la zona entre los “38.2% y los 61.8%”, llamada la zona dorada de los Retrocesos de Fibonacci, por lo que en ese sentido, este seria un buen punto de entrada en el ETH en gráficos de 4H y como podemos ver el precio se freno en ese punto y hasta los momentos esta subiendo poco a poco.
Por otro lado, trazando la “Extensión de Fibonacci”, los objetivos que pudiera tener el precio de seguir un rumbo alcista, están aproximadamente en los 38.2% de las extensiones de Fibonacci aproximadamente en los $422. Este es un tipo de estrategia que en ocasiones suelo utilizar combinado con otros indicadores que me brinden confirmación de que exista la probabilidad de que ese escenario trazado por las herramientas de Fibonacci se dé.
LEO Technical Analysis | Análisis Técnico de LEO
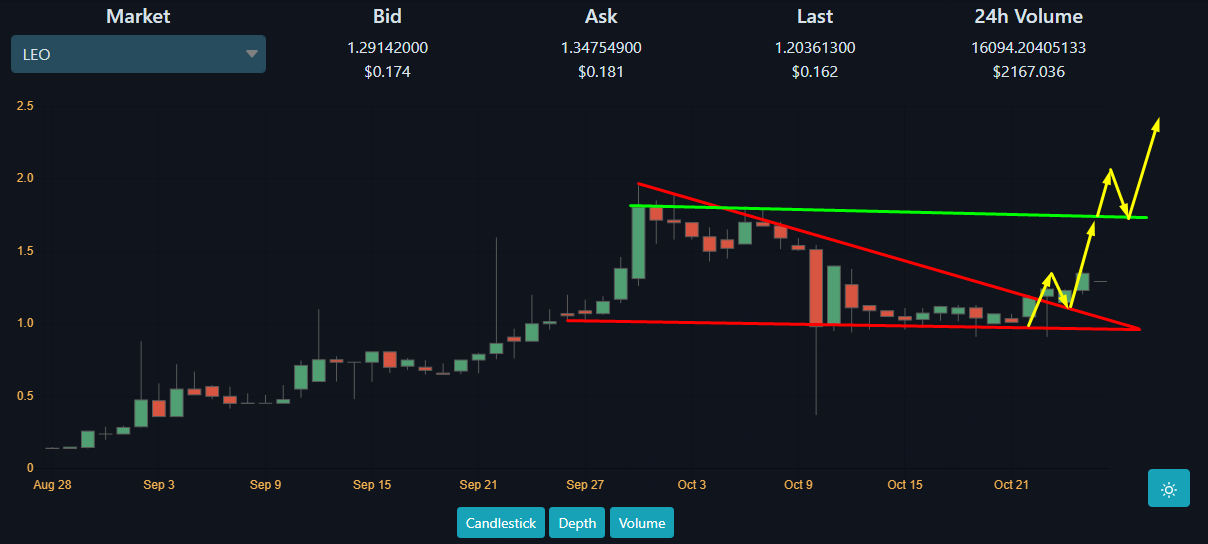
Screenshot of LeoDex
LEO's token had a good response to the last chartist formation I mentioned in previous publications, the probabilities were negative in that sense, since it spoke of a "Downward Triangle", being this a bearish pattern, where I observed another "Demand Zone" different for LEO.
However, the community and the constant work of the LeoFinance team, has recovered remarkably, breaking the "Downward Triangle" upwards, making a Pullback to the top of the triangle marking a very good entry and following its course for what I estimate will continue with an upward trend.
El token de LEO ha tenido una buena respuesta con respecto a la última formación chartista que mencione en publicaciones anteriores, las probabilidades estaban negativas en ese sentido, ya que hablaba de un “Triangulo Descendente”, siendo este un patrón bajista, donde observaba otra “Zona de Demanda” distinta para el LEO.
Sin embargo, la comunidad y el constante trabajo del equipo de LeoFinance, se ha recuperado notablemente, rompiendo al alza el “Triangulo Descendente”, haciendo un Pullback a la parte superior del triangulo marcando una muy buena entrada y siguiendo su curso para lo que estimo que seguirá con un rumbo al alza.
Conclusions
These main assets, such as BTC and ETH, are on a good upward trend despite the price corrections they may suffer in the short term, but the other probabilities are undoubtedly on the rise, so even so, my goals for these are at new highs for both. With respect to LEO, this is clearly a token that is having and will continue to have an increasingly strong valuation, I firmly believe in this project so LEO MODE ON.
LeoFinance is a Blockchain based social networking community for Crypto & Finance content creators. Our tokenized blog platform LeoFinance.io allows users and creators to participate and share content in the blockchain while earning token rewards LEO.
Estos principales activos como el BTC y el ETH, están en un buen rumbo alcista a pesar de las correcciones de precio que pudieran sufrir en el corto plazo, pero las demás probabilidades se encuentran sin duda al alza, así que, aun así, mis objetivos para estos están en nuevos máximos para ambos. Con respecto a LEO, este claramente es un token que está teniendo y seguirá teniendo una valoración cada vez mas fuerte, creo firmemente en este proyecto así que LEO MODE ON.
LeoFinance es una comunidad de redes sociales basada en Blockchain para creadores de contenido de Crypto & Finance. Nuestra plataforma de blogs tokenizada LeoFinance.io permite a los usuarios y creadores participar y compartir contenido en la cadena de bloques mientras obtienen recompensas de tokens LEO.


If you are new you can join the game under this LINK

Live the BraveBrowser Experience. Browse fast, safe while earning BAT tokens.
Please download the browser using my Referral Link.


Communities I support and promote


Join the official Discord community

Go to the Discord server community officer in Spanish
Posted Using LeoFinance Beta
Thank @lenonmc21 for sharing
I seem this time is for buying LEO because LEO is hot in Hive Blockchain.
Yes or No?
Posted Using LeoFinance Beta
Greetings dear @tin.aung.soe, thank you for commenting.
Please note that my recommendation is that you create content in LeoFinance so that the whole community can appreciate your content, I am not the one to tell you what investment to make, but in my case and in my opinion whenever I can I buy something from LEO to be able to bet it and upload my voting power, this is because I am sure that as time goes by the LEO token will revalue.
Financial Markets Analyst
@lenonmc21
Posted Using LeoFinance Beta