Was that not the biggest reversal candle you have ever seen?
Bitcoin just printed the biggest reversal candle I have ever seen on a 1 HR chart
Over the last several hours bitcoin has been doing it's thing, starting to get volatile again.
Bitcoin briefly plummeted (I use that word affectionately so don't get all bent out of shape) all the way down to the low $34ks before bouncing back in a big way.
The end result is the largest reversal candle I have ever seen on the 1 HR chart.
Sees:
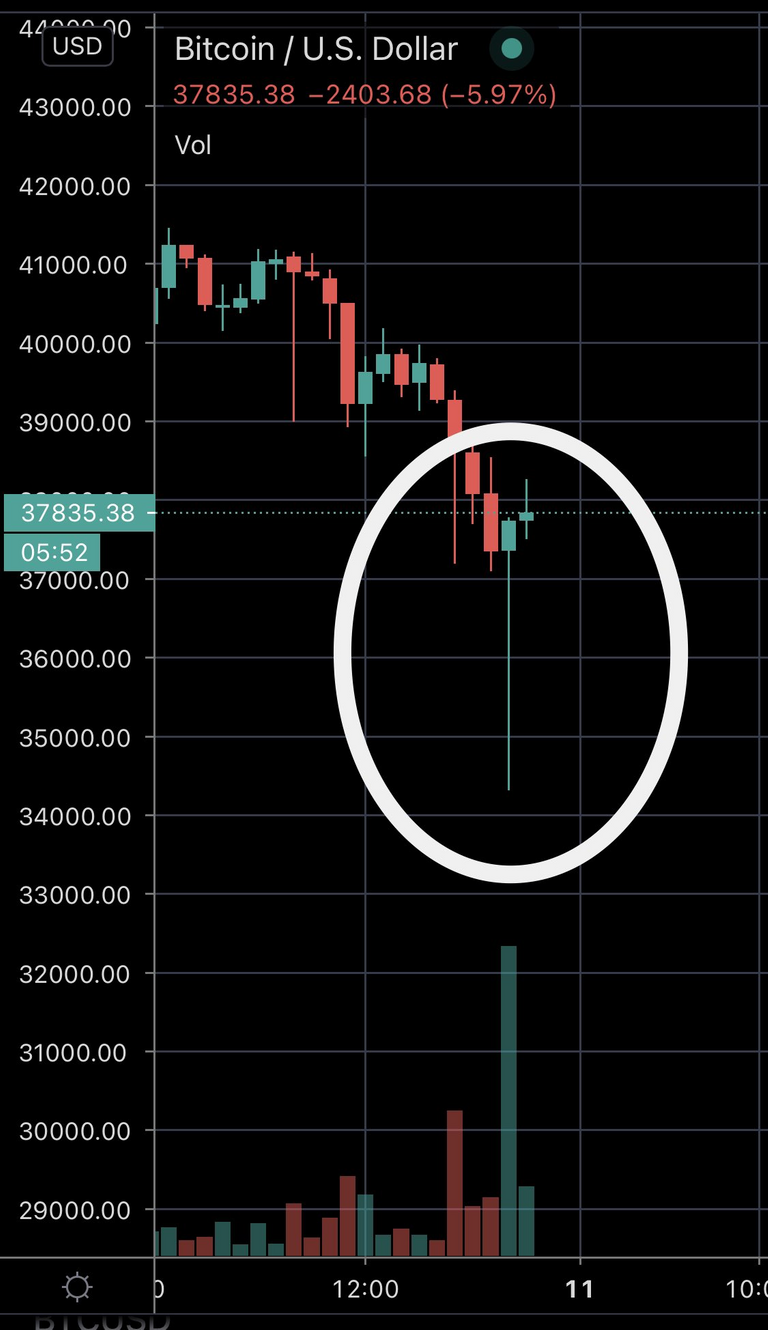
(Source: https://bittrex.com/Market/Index?MarketName=USD-BTC)
That thing started around the $38k level and dropped all the way down to the $34k level.
Ok, so maybe I have seen bigger drops on a penny stock or some other small market cap asset, but on a $500 billion dollar asset, this is pretty big.
And now we are moving back up to where this whole thing started, currently trading for $39k again.
Most importantly, it happened on massive volume likely taking out a ton of stops and guys on margin.
See if you can spot the volume bar for this move:
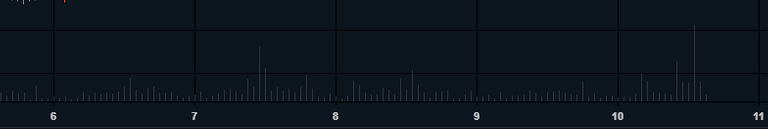
(Source: https://bittrex.com/Market/Index?MarketName=USD-BTC)
It was almost double the previous highest 1 hour volume bar over the last week.
The bulls ate up that drop like hungry hungry hippos.
If this doesn't mean we are all set to go back and challenge those highs at $42k in the next couple days I don't know how to interpret charts and technical analysis is completely useless.
Sellers are now out, buyers back in control, watch where they take the price next.
Posted Using LeoFinance Beta