Learning Technical Analysis #8 | MACD
#8 MACD
The MACD stands for Moving Average Convergence/Divergence. This is a popular and effective momentum technical indicator that builds upon the moving averages which were covered in my last post (#7 Moving Averages)
What the MACD Does.
It basically visualizes how momentum is progressing and if it's a steep up/downtrend or gradual up/downtrend using 3 different moving averages (12,26 and 9 EMA's). The way it is calculated is that it takes the difference between the 12 and 26 EMA and plots them over the 9-period EMA. The gap between these is put into bars which indicate momentum and strength of the momentum.
Adding MACD on Tradingview
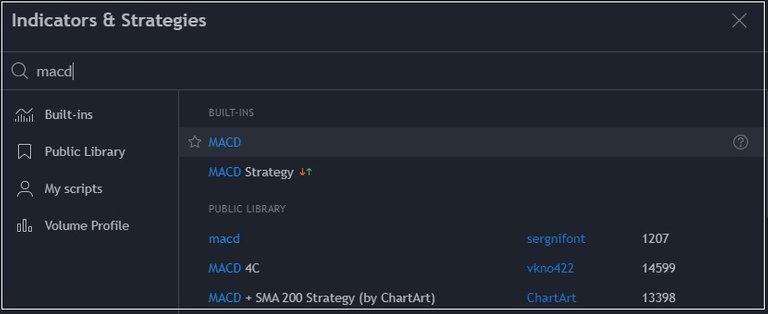
Similar to the other Technical Indicators, just go to "Indicators & Strategies in Tradingview, search for MACD and add it to your chart.
Indicating Top & Bottoms
When looking at the MACD on longer-term timeframes it tends to indicate clear trend reversals. For example on the monthly chart for Bitcoin, whenever there was a smaller bar compared to the previous it indicated a top while a bigger bar compared to the previous it indicated a bottom.
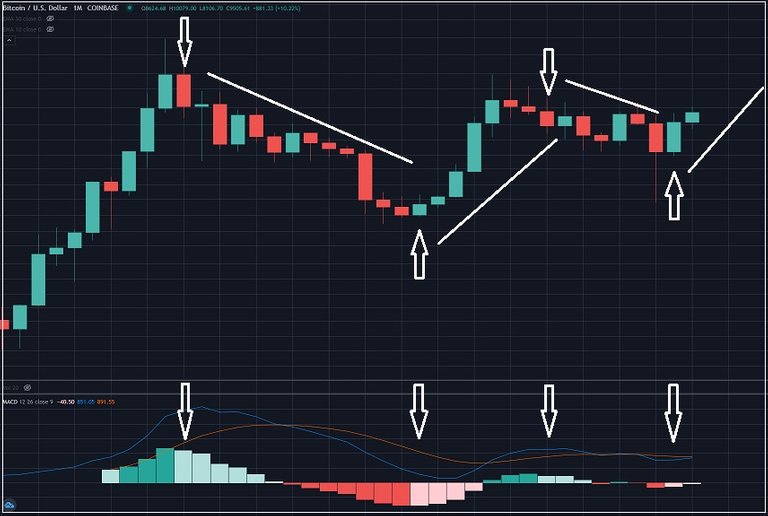
The more you zoom in on a smaller time-frame, the less accurate it gets though and in the end, it's just another indicator to possibly use on top of others signs. The way it is used in the short run also is different compared to the longer term.
Bullish Divergence
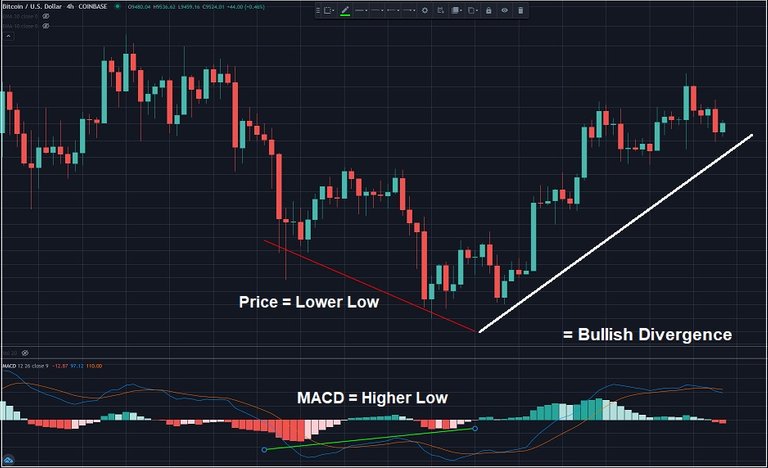
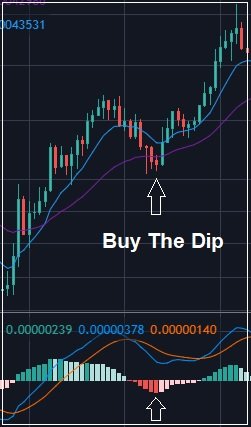
Something you often hear in Technical Analysis videos on youtube is the MACD bullish divergence. The steepness of the MACD bars becomes less sharp (higher low) while the price has set a lower low, this is called a bullish divergence as the momentum to the downside is starting to weaken signaling a momentum change.
Buying the Dip
Previous Technical Analysis Lessons
Technical Analysis #1 | Basics
Technical Analysis #2 | Trends
Technical Analysis #3 | Bearish Patterns
Technical Analysis #4 | Bullish Patterns
Technical Analysis #5 | Symmetrical Triangles
Technical Analysis #6 | Volume Indicator
Technical Analysis #7 | Moving Averages
Future Articles in this series
Publish0x | Costanza Technical Analysis
Free Software I use for Charts Tradingview | The Platform I use for Trading Binance |
|---|
|
|
|
|


Posted Using LeoFinance
@tipu curate
Upvoted 👌 (Mana: 3/6)