Hive/USDT Chart Update
Hi. I haven't shared chart analysis for a long time. I've been following Hive the most lately. What trades have you taken with candlestick moves since the last post? we'll take a look at it. The first chart is the weekly Hive chart.

As seen in the weekly chart, we are above the long-term supply-demand zone. It tested the supply-demand region once last Thursday. However, the Hive price received the reaction of this region. Let's see if we can survive this episode. Or when will we test the upper supply-demand region.
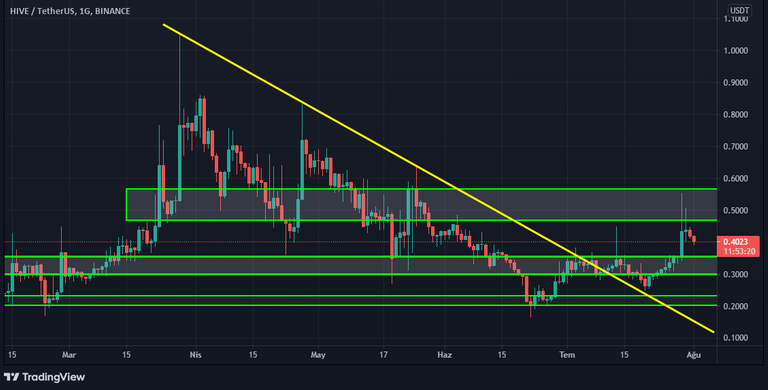
The chart above is daily. We have been experiencing a downtrend since the beginning of April. There has been an uptrend recently. Let's see what time will tell.
I am not an investment advisor. I do not recommend. This would be more useful as a training exercise. Positioning on new posts.
Yay! 🤗
Your content has been boosted with Ecency Points, by @anadolu.
Use Ecency daily to boost your growth on platform!
Support Ecency
Vote for Proposal
Delegate HP and earn more
as you say you are not an investment advisor
neither am i
but i think downtrend will not continue....we will see higher levels in the next months...
i hope 1000 BTC sats will be a strong support limit
While there was an uptrend, Hive could not benefit from this rise anyway. I hope the rise continues.
@anadolu! This post has been manually curated by the $PIZZA Token team!
Learn more about $PIZZA Token at hive.pizza. Enjoy a slice of $PIZZA on us!