Bitcoin Analysis for 22/01/2021

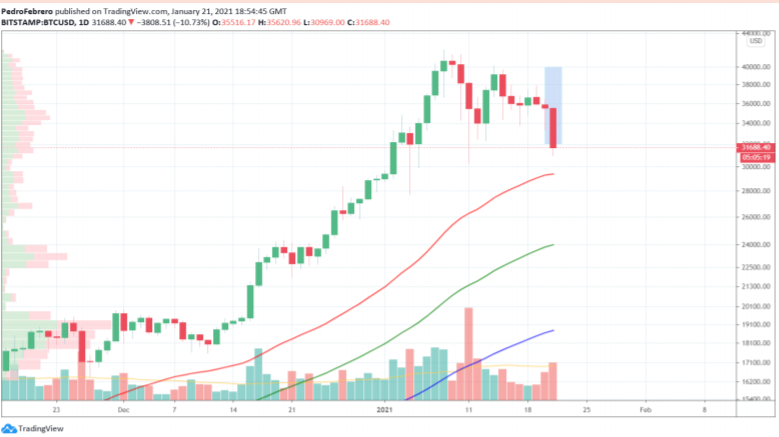
This week, the price of bitcoin has been quite bearish, and the cryptocurrency just broke down the accumulation range between $35,000 and $39,000. These are extremely bearish indicators and we do expect the price to continue to fall towards the 20-day EMA (red line).
Today, BTC/USD has moved back below $32,000, according to CoinGecko, and is currently sitting at $32,680.
Yesterday, we wrote that we expected the price of bitcoin to keep trading between $35,000 and $39,000, but the market had other ideas. Short sellers entered the market and pushed the price of bitcoin below $35,000.
Unless we see large sums of fresh cash flooding to bitcoin, there is little chance the trend significantly reverses anytime soon.
Therefore, we expect the next couple of days to be bearish and for BTC/USD to keep trading below $35,000.
Interestingly, today, extremely bullish and bearish news came out. First, Bloomberg linked the recent price crash to the potential double spend on the main net. On the same day, Coindesk highlights how Blackrock
“appears to have granted at least two of its funds the ability to invest in bitcoin futures.”
Hence, we should expect volatility to increase as whales scoop-up bitcoin from dumb money, on the cheap. We discuss more on all subjects, next.
To conclude our introduction, we think that before we see BTC/USD move above its record price of ¥4,357,000, we need to see sellers being exhausted. Hence, this price correction is an opportunity to add more bitcoin to one’s portfolio.
For now, we think BTC/USD might have a few extra bounces between $30,000 and $35,000 before starting its rally towards $40,000; once the price of bitcoin breaks out of the consolidation zone, we should see a move toward $50,000.
As a reminder, we are confident BTC/USD will continue to move upward if:
- BTC/USD remains above its 20-day EMA (red), 50-day EMA (green) and 200-day EMA
(blue). - BTC/USD doesn’t drop below $30,000.
- BTC/USD daily volume goes back above its 21-day Moving Average.
What Do Traders Think?
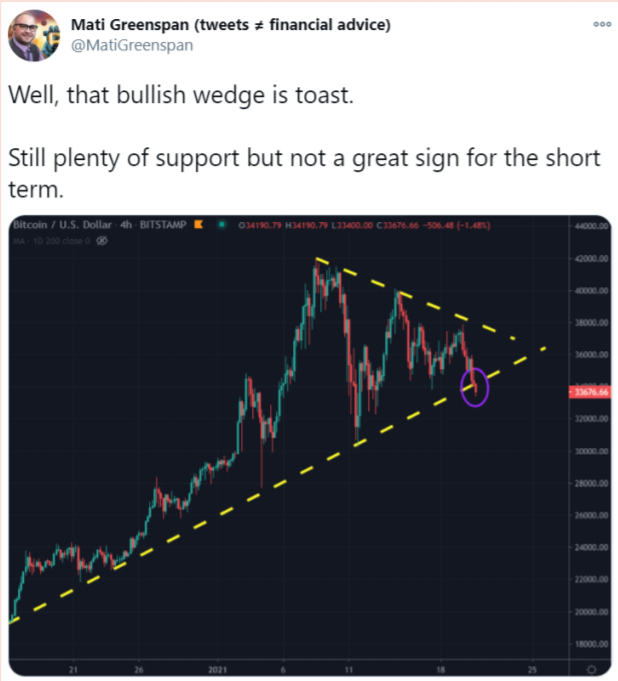
The first tweet we would like to share comes from Mati Greenspan, founder of the cryptocurrency research firm Quantum Economics, as well as a trader, investor, and licensed portfolio manager.
In his post, Greenspan shares a 4-hour chart of the price of bitcoin. He added two trendlines, one showing support at the bottom and the other showing resistance at the top. The trader highlights (purple) how the price broke the support line, which is a bearish sign.
Greenspan wrote:
“Still plenty of support but not a great sign for the short term.”
Essentially, BTC/USD was trading inside a falling wedge, a bullish pattern, which according to Investopedia means
“The trend lines drawn above the highs and below the lows on the price chart pattern can converge as the price slide loses momentum and buyers step in to slow the rate of decline. Before the lines converge, price may breakout above the upper trend line.”
However, since the price of bitcoin has now broken this trend, the movement may be steeper than what we previously anticipated.
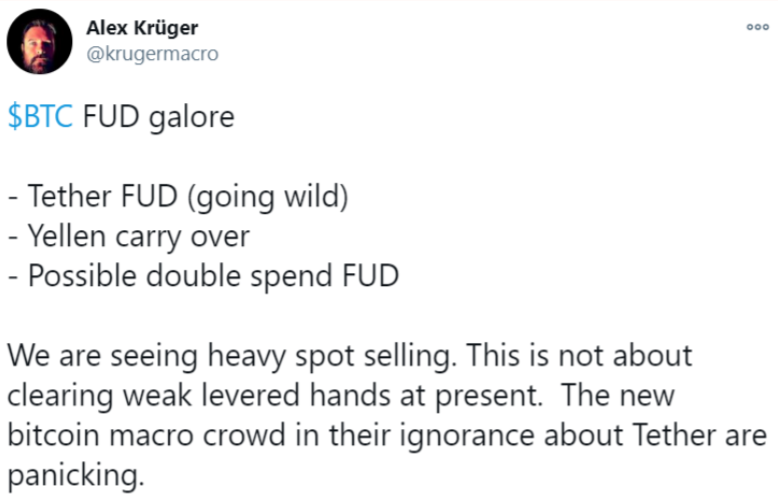
The next update builds on Greenspan’s post and comes from Alex Kruger, an economist and trader with more than 55,000 Twitter followers.
Kruger wrote that the current sell-off is being fueled by the following FUD (Fear, Uncertainty and Doubt):
“Tether FUD (going wild)”, “Yellen carry over”, “Possible double spend FUD”.
Essentially, several reasons have been attributed to the recent bitcoin price dip. Adding to what we wrote yesterday, that an article argued Tether would collapse soon and that regulators would attempt to shut down bitcoin, today news came out that the Bitcoin protocol might have suffered a double-spend at block 666833. This added more fuel to the fire, even though there was no actual double spend, where the same coins are spent twice and both transactions are accepted as valid in the main chain.
However, as Mark Cudmore from Bloomberg wrote, that is not the case:
“A couple of readers have written in to educate me on what has happened. Double-spend attempts happen frequently. The blockchain itself has never been corrupted (that we know of). However, slow transaction confirmations open up the potential for someone to try to double spend their coins. This is why transactions being confirmed via multiple blocks are a design feature of Bitcoin, rather than a bug. Someone using a single block confirmation is arguably missing the point as this was addressed in the Satoshi whitepaper. Six confirmations (blocks) are often considered “secure.”
Therefore, as Kruger notes
“We are seeing heavy spot selling.”
At present, unless buyers came to the rescue, we could see a continuation of the sell-off. Will the trend reverse anytime soon?
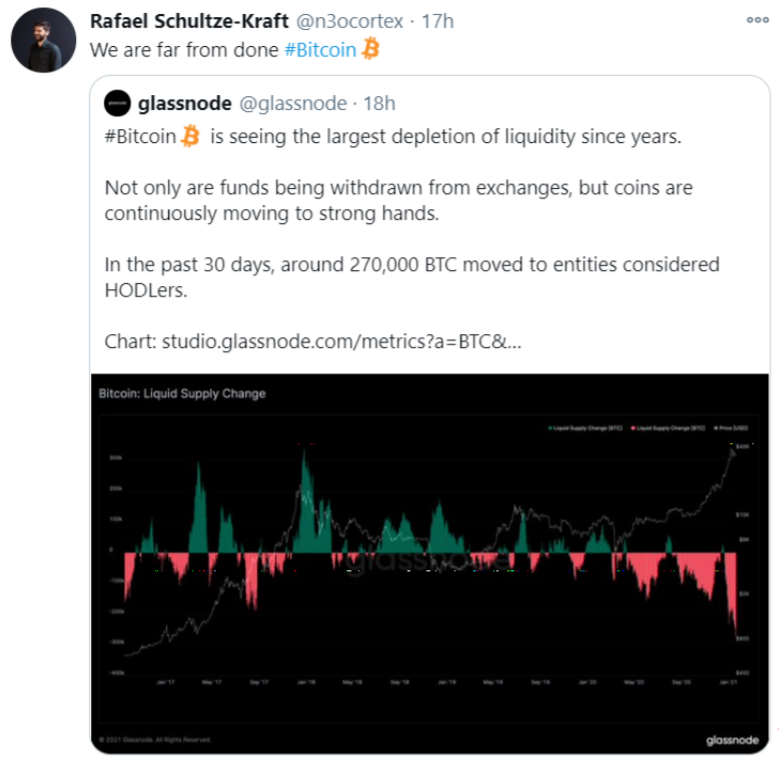
To add to the previous tweet, we would like to share this post by Rafael Schultze-Kraft, whose Twitter profile describes him as a data scientist, on-chain analyst, and CTO at Glassnode.
Schultze-Kraft shared a post from Glassnode showing a chart of the Bitcoin: Liquid Supply Change. The conclusions we can take from the data couldn’t be more uplifting. Just like Glassnode wrote:
“In the past 30 days, around 270,000 BTC moved to entities considered HODLers.”
This means the bitcoin left exchanges and moved to addresses that will most likely hodl the coins for long periods. Also, recent data shows that the number of entities holding over 1,000 bitcoin keeps increasing. As Cointelegraph reported last week:
“Statistics governing wallet balances from Glassnode on Jan. 11 reveal that the main investors “buying the dip” are those with a balance in excess of 1,000 BTC ($36 million).”
Hence, we do not think investors and traders should sell all their bitcoin positions, given that whales (smart money) are buying the dip and “stealing” bitcoin from retail investors.
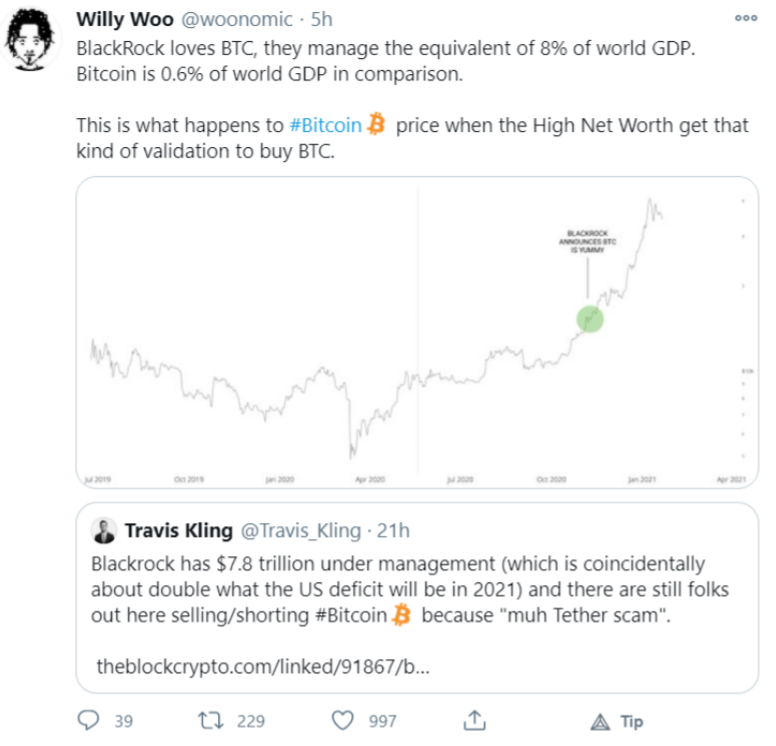
The last post of the day comes from Willy Woo, a crypto analyst whose Twitter profile describes him as “pioneering on-chain analysis.”
We would like to conclude the week by discussing one of the most critical pieces of news in the past few months. That the largest fund in the world, Blackrock, that holds over $7 trillion AUM, seems to be interested in acquiring bitcoin.
As Michael McSweeney from the Block reports:
“Twin filings with the Securities and Exchange Commission (SEC) suggest that BlackRock, the trillion-dollar asset management giant, is set to make allocations to bitcoin futures via some of its funds.”
If Blackrock enters the bitcoin game, a large quantity of the entire bitcoin supply could be scooped up in a short time, creating a considerable gap between supply and demand. What usually happens when supply dries up and demand increases?
The price skyrockets.
To prove our thesis, Woo adds a sequential post showing the Bitcoin Whale Count, that we share below.
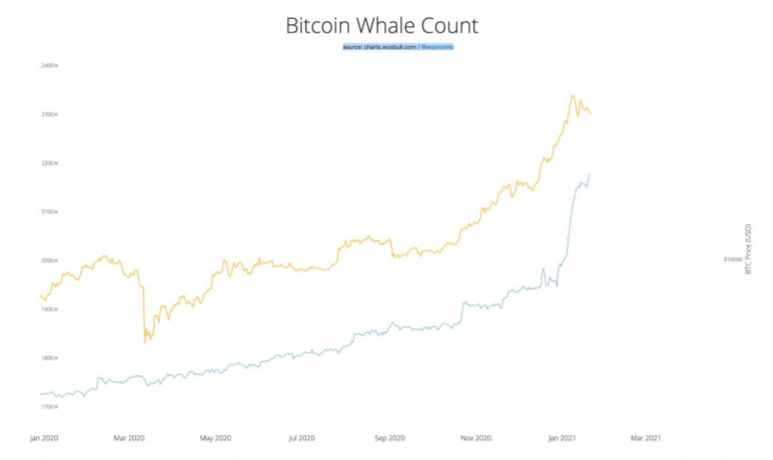
As we wrote previously, the number of bitcoin addresses holding large sums of bitcoin are increasing; plus, this trend might create a game-of-chairs effect, where no institution wants to be the last to acquire a position in bitcoin.
For now, let’s discuss how we think the price of bitcoin will move today and what we expect to happen during the weekend.
Bitcoin Price Prediction
This week, bitcoin had a significant fallback of more than 15%, according to CoinGecko. The downtrend started with a major sell-off last weekend that continued throughout the week. Today, the price went below the predicted price range between $35,000 and $39,000.
At the time of writing, the price of bitcoin is above $31,670.
Even though we expected the price to start its recovery soon, it seems sellers are taking their time and buyers are still not ready to come in full force, even with the extremely bullish news that Blackrock might dip its toes in the bitcoin space, soon.
Today we discussed how most traders see the price moving in the short-term and why it is crashing. The reason is mostly attributed to retail investors selling their bitcoin to whales, that keep pushing the price down to further accumulate even more coins.
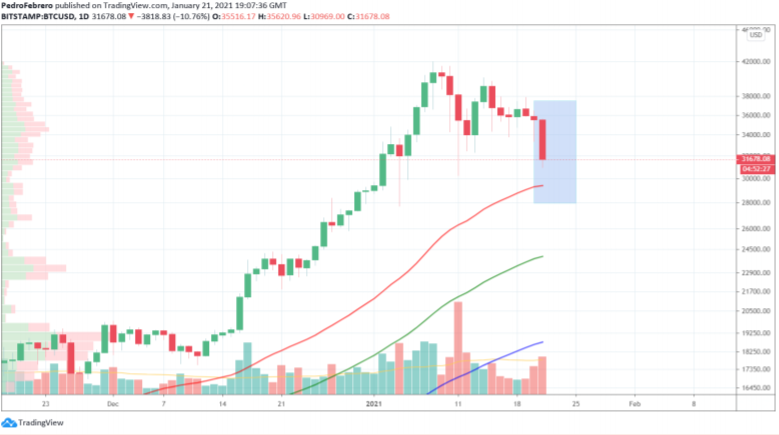
How do we think the price will trade today? As shown in the above chart, we think that bitcoin could find a top close to its previous record price close to $38,000, but we highly doubt BTC/USD comes close to reaching this target. So far this week, sellers have been completely in control.
On the other hand, we don’t expect the digital currency to drop much below $28,000, due to the sheer number of buy orders placed at $27,000 and $29,000.
To finalize, the Volume Profile Visible Range (VPVR) shows a high number of buy orders between $31,000 and $37,000, and then again between $27,000 and $29,000, which means BTC/USD should not go below $30,000, even if things deteriorate significantly.
As a reminder, we think it’s still possible BTC/USD finds a brand new record price, around the $50,000 price range until the end of the month. Take the opportunity to buy some bitcoin with a significant 15% to 20% discount.
Posted Using LeoFinance Beta
https://twitter.com/Alberto35623593/status/1352352841621532683
I followed your account to learn Crypto from you.
Posted Using LeoFinance Beta
Thanks a lot for following me
Posted Using LeoFinance Beta