Bitcoin Analysis for 21/01/2021

This week the price of bitcoin has been quite bearish and is sitting in an accumulation range between $33,000 and $38,000. Yesterday, it seemed the market was turning around, but more sellers arrived and pushed down BTC/USD.
Today, BTC/USD has moved back below $35,000, according to CoinGecko, and is currently sitting at $34,990.
Yesterday, we wrote that we expected the price of bitcoin to keep trading between $35,000 and $39,000, and that’s precisely what has happened,. We think there is little chance the price of bitcoin will move out of the current accumulation range, without large sums of money coming into bitcoin.
Therefore, we expect the next couple of days to be bearish, and for BTC/USD to keep trading below $40,000.
Exceptionally, we notice how BTC/USD is finding a significant number of buyers above $35,000 an important indicator that the long-term upward trend remains.
Today an excellent article came out with precise analysis regarding why the price of bitcoin will most likely move above $40,000, soon. As reported by Cointelegraph:
“In 2021 alone, 164 new 1,000+ BTC entities were created, together controlling around $6 billion. While these may not all denote whales increasing their positions, the numbers feed into an existing narrative of wealth transfer which has characterized Bitcoin's latest bull run. Cointelegraph added that “the 1,000+ BTC wallet category was the only one to increase in recent times, with smaller wallet holder numbers conversely dropping.”
Therefore, just like we discuss in the next section, large institutional buyers seem to be behind the most recent price appreciation and price dump. However, it is unlikely a significant portion of the bitcoin whales have accumulated, have been sold.
To conclude our introduction, we think that as the price of bitcoin rises, more buyers will enter the space. However, the time for that hasn’t come yet. Before we see BTC/USD above its record price of $42,200, we need to see sellers being exhausted.
For now, we think BTC/USD might have a few extra bounces between $33,000 and $38,000; once the price of bitcoin breaks out of the consolidation zone, we should see a move toward $40,000 and then $50,000.
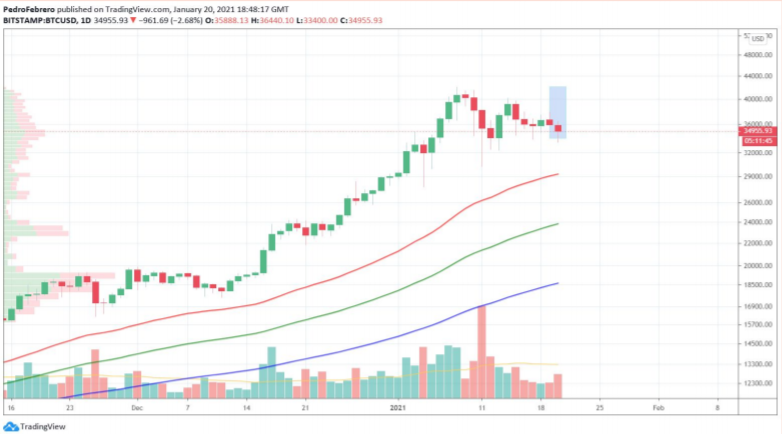
As a reminder, we are confident BTC/USD will continue to move upward if:
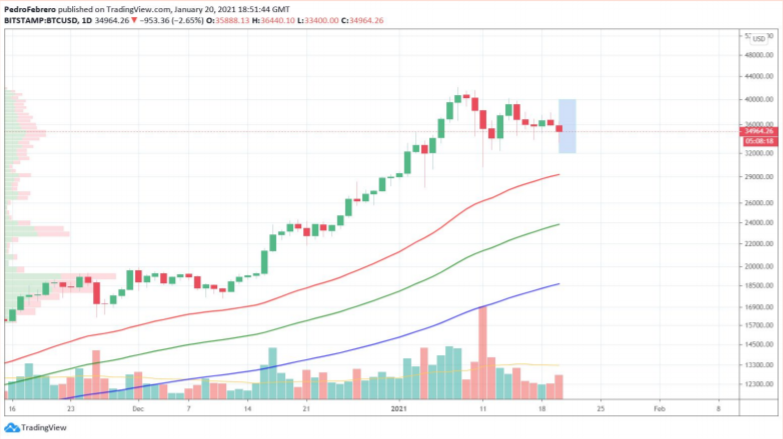
- BTC/USD remains above its 20-day EMA (red), 50-day EMA (green) and 200-day EMA
(blue). - BTC/USD doesn’t drop below $33,000.
- BTC/USD daily volume goes back above its 21-day Moving Average.
What Do Traders Think?
The first tweet we’ll discuss comes from Joseph Young, whose Twitter profile describes him as an analyst focusing on finance and cryptocurrency, as well as a contributor to Forbes and Cointelegraph. He currently has over 100,000 Twitter followers.
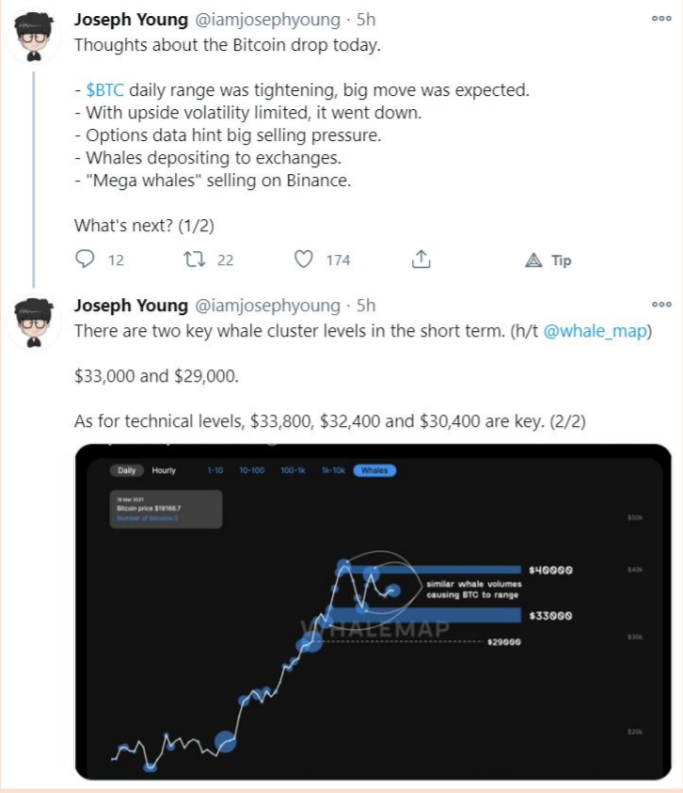
In the post, Young shares many important reasons that can partially explain the most recent downwards price action. In the tweet Young wrote his thoughts on why the price of bitcoin dropped:
“$BTC daily range was tightening, big move was expected.”, “With upside volatility limited, it went down.”,
“Options data hint big selling pressure.”, “Whales depositing to exchanges.”, "Mega whales" selling on Binance.”
First, the analyst mentions the triangle where the price is currently trading in-between, and how this range is tightening, which usually means a sudden move either up or down. Additionally, he highlights the low volatility which is an excellent sign. More on that later.
Young adds a second tweet and shares a chart by Whalemap, that contains two blue areas
indicating the ranges where whales are both selling and accumulating. These ranges appear around $33,000 and $40,000; hence, we can expect BTC/USD to remain within this price range for a few more days.
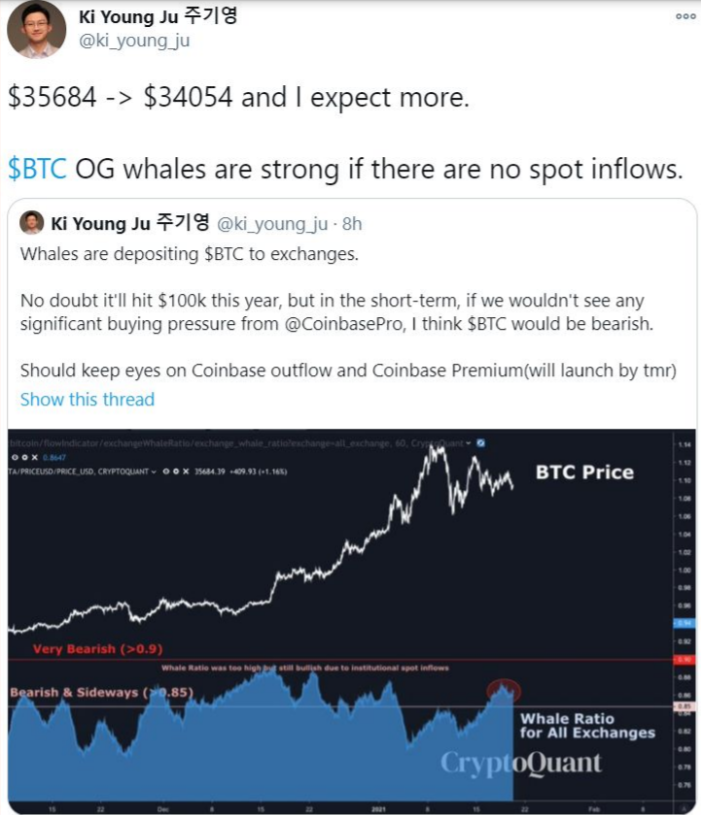
The next tweet builds on the prior post and comes from Ki Young Ju, CEO at CryptoQuant.com
In his post, Ju wrote he expects the price of bitcoin to trade between the $33,500 and $34,000 range for a while. He also adds that in case no buyers come to the rescue, it seems the price will continue to drop.
To support his thesis, Ju shared an earlier post of his from today, where he shows the chart of BTC/USD and adds the Whale Ratio for all Exchanges. Usually, once this indicator is above 0.85 it means that the price will move sideways and the market will turn bearish.
The reason is that it shows the deposits of whales to exchanges, and once those start to increase price tends to drop. Unless, of course, buyers come to the rescue.

The third tweet of the day comes from Eric Weiss, the CEO of the Bitcoin Investment Group.
In his post, Weiss wrote a tremendous courageous post that should serve as a lesson to all investors and traders who are too exposed by selling all their bitcoin positions.
Even though we all wish we could time the market perfectly, that’s just simply not true. So we should already be prepared to not time the next bitcoin cycle top with 100% accuracy.
Hence, we do not think investors and traders should sell all their bitcoin positions, given the fact the price may grow to so much higher levels, it becomes impossible to acquire as much bitcoin as one previously held.
As Weiss wrote:
“I sold my #Bitcoin in early 2014. I’ve been trying to buy it back ever since. I still haven’t been able to buy back as much as I sold.”
Remember that taking profits is as important as managing your assets properly. If you sell too early, you may miss the best trading days.
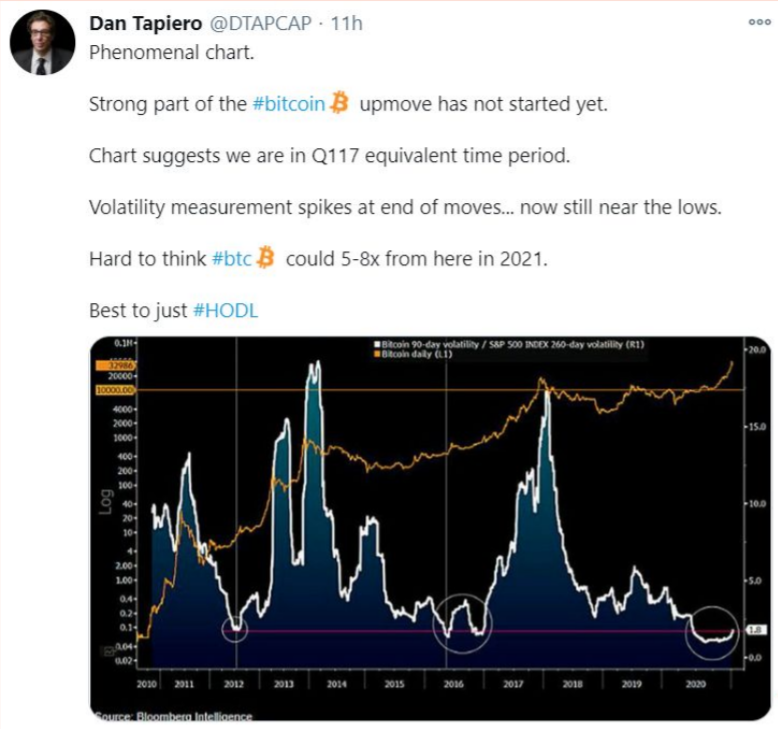
The last post of the day comes from non-other than Dan Tapiero, who is a legendary global macro
investor with over 25 years of experience and also the founder of DTAP Capital.
Tapiero shared an extremely important chart containing both the price of bitcoin (orange) and the
Bitcoin 90-day volatility / S&P 500 INDEX 260-day volatility (white).
What the data shows is that, historically, the price of bitcoin tends to find its next top once the Bitcoin 90-day volatility / S&P 500 INDEX 260-day volatility goes above 10 points. In the previous cycle, this indicator hit over 15 points, before the price came crashing down.
The analyst highlights how important it is for the market to shake out weak hands that recently bought bitcoin.
As Tapiero wrote:
“Strong part of the #bitcoin upmove has not started yet”.
Just consider that the price of bitcoin hit a new all-time high in December 2020, while the volatility indicator was below 5 points.
Hence, just like the macro analyst concluded, if the volatility indicator starts to move upwards “#btc could 5-8x from here in 2021.”
A top cycle price between $150,000 and $300,000, would be quite a feat to experience.
Let’s come down from dream-land and discuss how we think the price of bitcoin will move during the day.
Bitcoin Price Prediction
Over the weekend, bitcoin had a significant fallback of more than 15%, according to CoinGecko.
During the week, the downtrend continued and even though yesterday it seemed the price was uplifting, that was nothing but a mirage. Today, the price continued to trade between the predicted $33,000 and $38,000 range.
At the time of writing, the price of bitcoin is close to $35,000.
Even though the price is currently consolidating, we don’t see a reason why bitcoin couldn’t go above $50,000 by the end of this month. Once the price of bitcoin finds the end of the ascending triangle, we think it will make a massive move up. As most analysts and traders anticipate, the next run-up could take bitcoin to brand new all-time highs.
Today we discussed how most traders see the price moving in the short-term and why it is crashing. The reason is mostly attributed to large bitcoin holders, whales, who are moving bitcoin to exchanges, most likely to sell a portion.
How do we think the price will trade today? As shown in the above chart, we think that bitcoin could find a top close to $40,000, but we highly doubt BTC/USD comes close to reaching this target.
On the other hand, we don’t expect the digital currency to drop much below $32,000, due to the sheer number of buy orders placed between $33,000 and $35,000.
To finalize, the Volume Profile Visible Range (VPVR) shows a high number of buy orders between $31,000 and $37,000, and then again between $27,000 and $29,000, which means BTC/USD should not go below $30,000, even if things deteriorate significantly.
As a reminder, we think it’s still possible BTC/USD finds a brand new record price, around the $50,000 price range until the end of the month.
Posted Using LeoFinance Beta
https://twitter.com/Alberto35623593/status/1351978991637458947