Hive Statistics – 2020.12.27

Welcome to the daily analytical report about the Hive blockchain.
All the information presented in this report is based on the data collected from the blockchain until 2020-12-27 midnight UTC time. The goal of this report is to provide you with a clear view of what is happening on the Hive blockchain.
 Dieser Beitrag ist ins Deutsche übersetzt: hier
 Une version en français de ce post est disponible - ici
1. New users
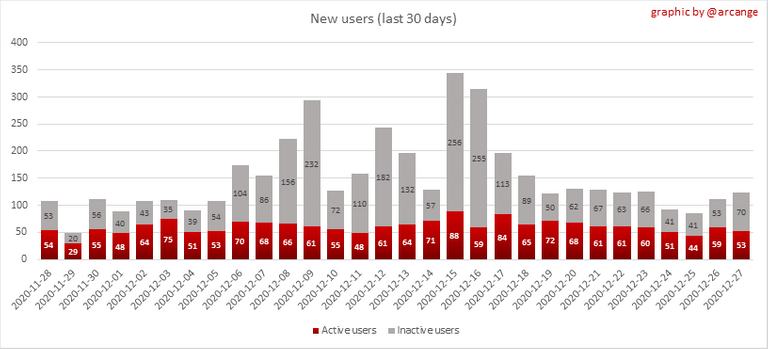
This chart shows the number of newly registered users on the blockchain and how many of them became active. The chart is kind of dynamic! A user can register one day and become active a few days later. Therefore, the number of active users on a specific date may change from day to day.
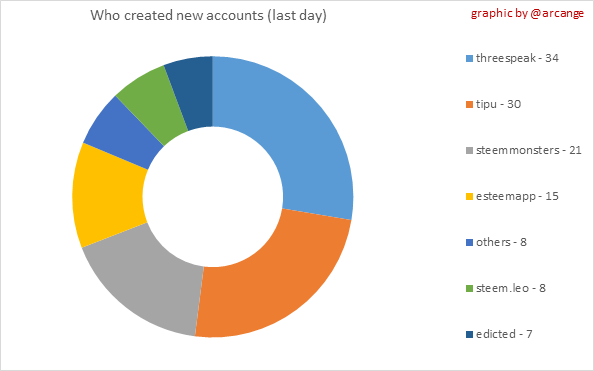 |  |
These two graphs show who created new accounts during the last day and the total number of registered accounts. The red line shows how many of them have been active at least once (active meaning publishing a post, commenting or voting). They are included even if they become inactive later.
2. Active users
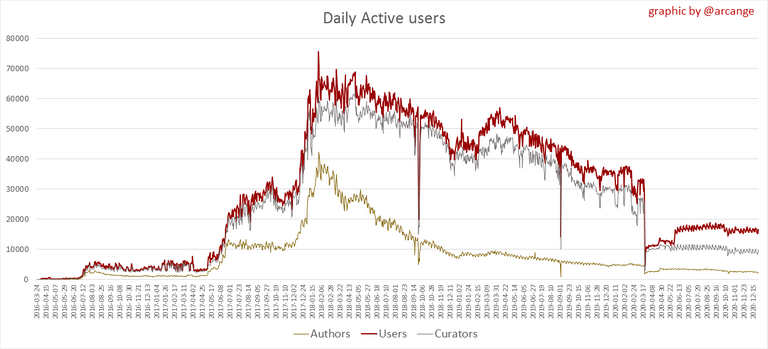 | 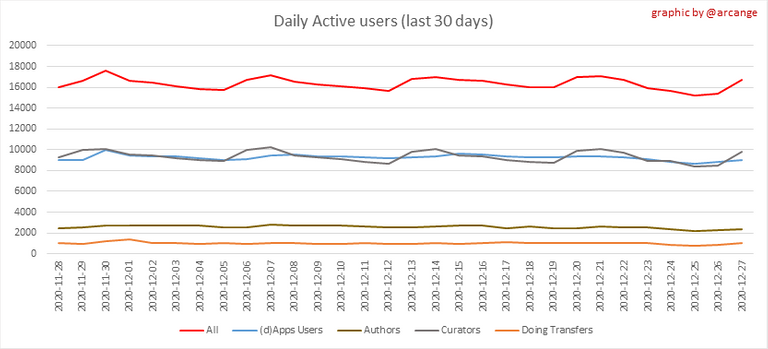 |

These graphs show the activity of users over time and in more detail for the last 30 days. In these graphs, "active users" are those performing any type of transaction on the blockchain.
The last graph is a monthly summary of the active users. Be careful when interpreting the value of the last column which can be much lower if the end of the month has not yet been reached.
3. Apps & (d)Apps
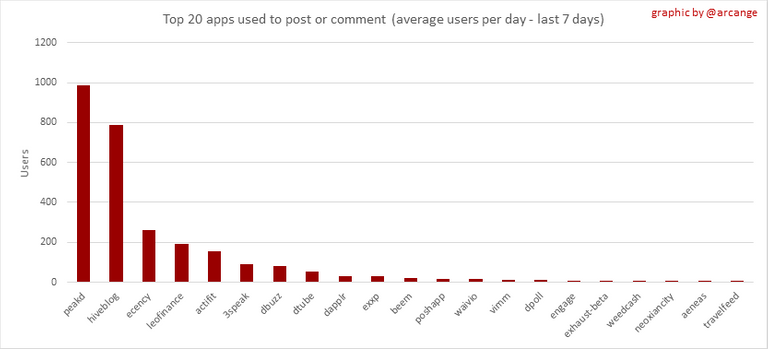
This graph shows which applications are most used to publish posts and comments. Please note that the same user can use several different applications.
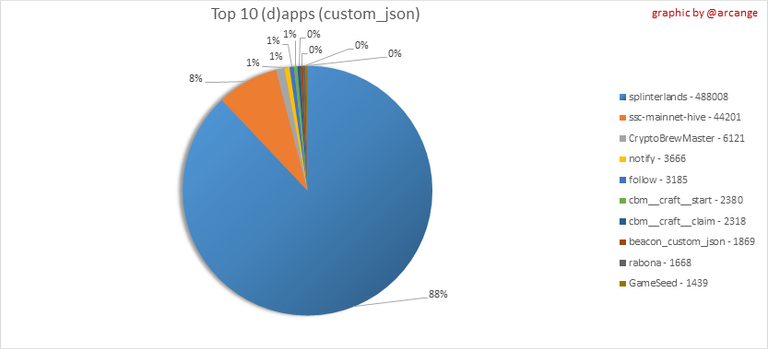
This graph shows which applications generate the most activity (custom_json operations) on the blockchain.
4. Posts And comments
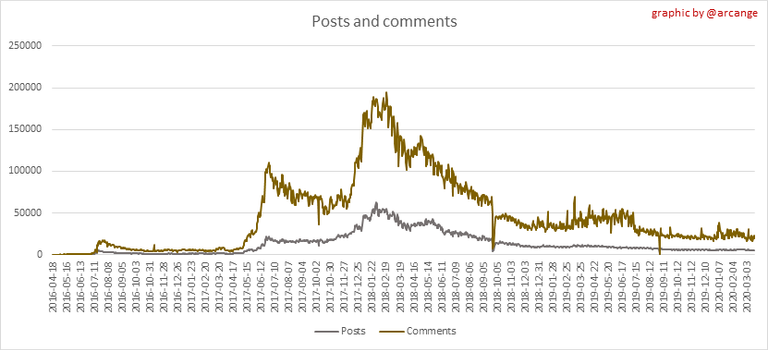 | 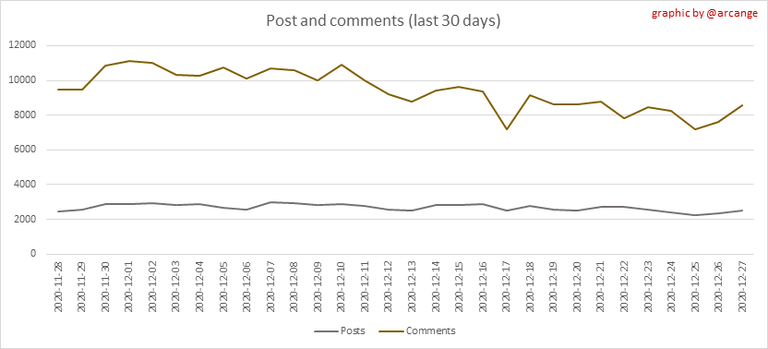 |
These graphs show the evolution of posts and comments for the whole blockchain lifetime and for the last 30 days.
5. Curation
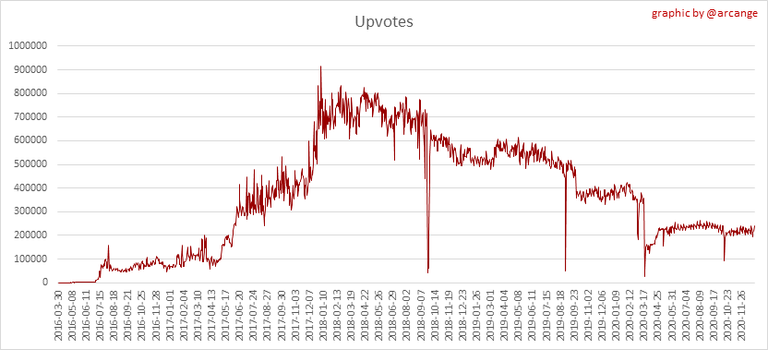 | 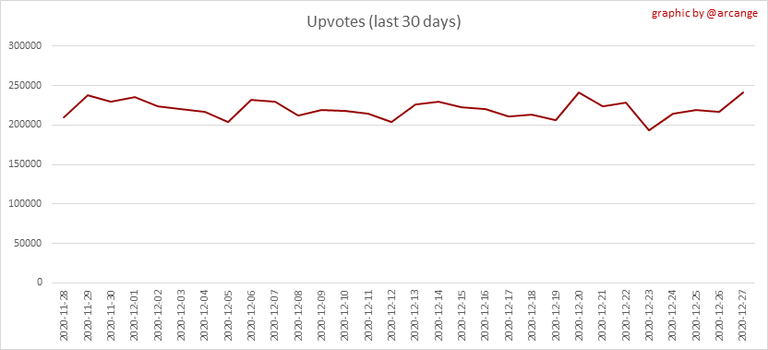 |
These graphs show the evolution of curation (upvotes) for the whole blockchain lifetime and for the last 30 days.
6. Daily transactions
![]()
This graph shows the number of daily transactions. This gives you an idea of the whole activity on the blockchain.
![]()
This graph shows the distribution of the top 15 types of transactions by number of operations performed on the blockchain.
7. Communities and Tags
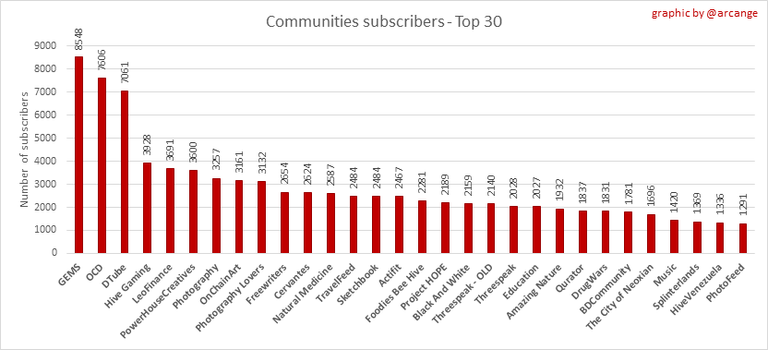
This graph shows the communities with the most subscribers.
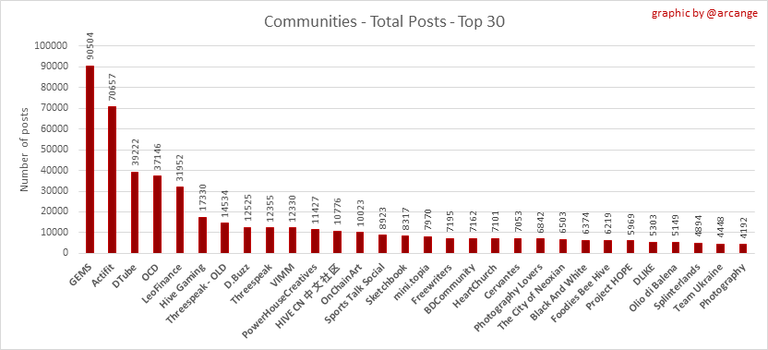 | 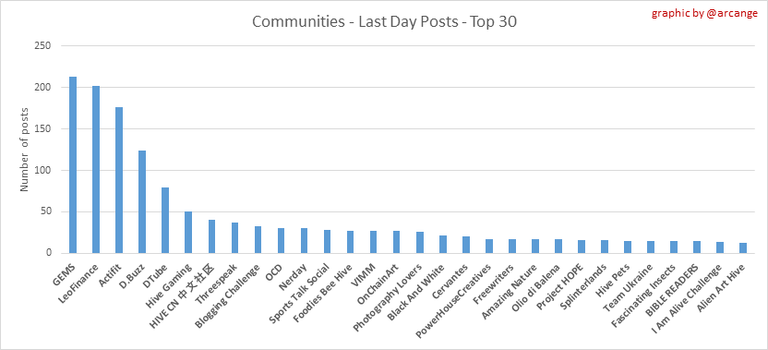 |
These graphs show the most active communities by number of posts (blockchain lifetime and last day).
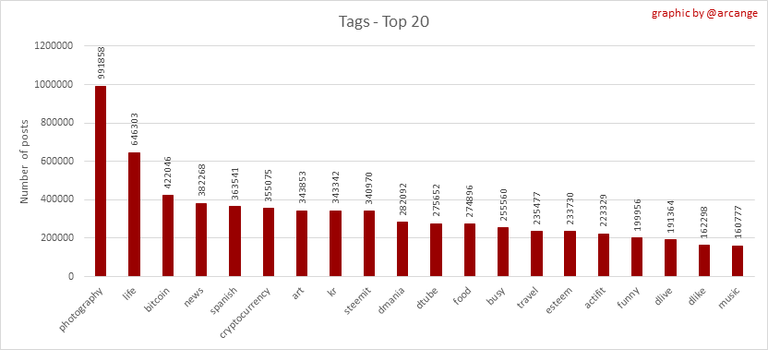 | 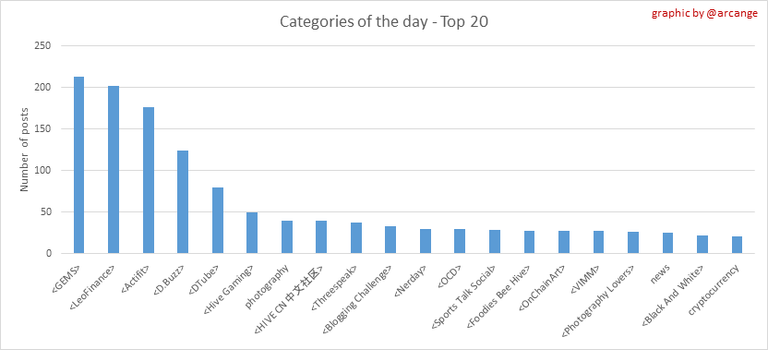 |
These graphs show which main tags have been the most used for publishing posts for the whole blockchain lifetime and for the last day.
8. Distribution
 | 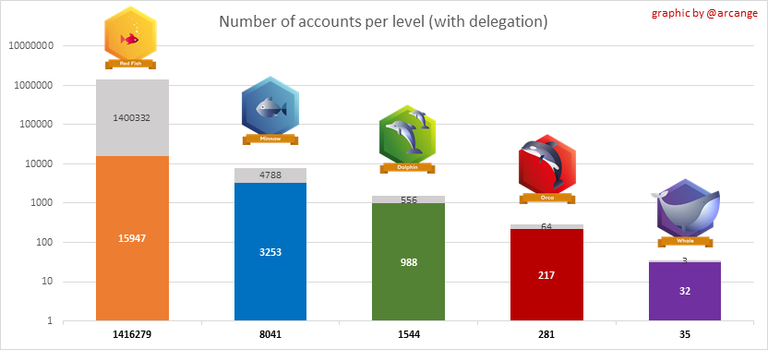 |
These graphs show the number of users according to their Hive Power. The left graph shows the distribution without taking into account any delegation made or received by the accounts. The right graph takes into account delegation, adds received HP delegation and subtracts given HP delegation.
The grey portion of each column indicates how many accounts are inactive (those who have not posted, commented or voted for the last 30 days).
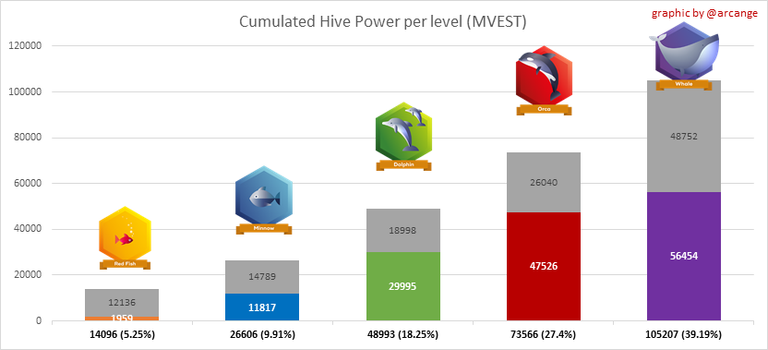 | 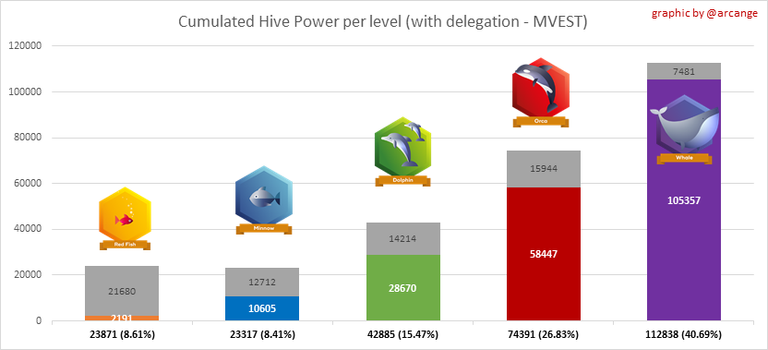 |
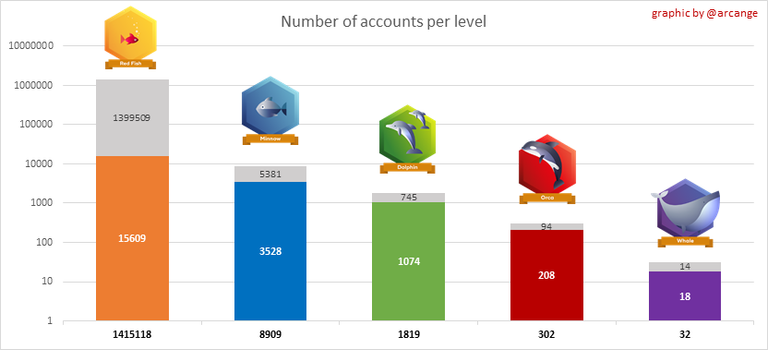
This graph shows the distribution of Hive Power cumulated per account level. The left graph shows the distribution without taking into account any delegation made or received by the accounts. The right graphs take into account delegation, adds received HP delegation and subtracts given HP delegation.
The grey portion of each column indicates unused Hive Power by inactive accounts (see above for the definition of inactive).
Below each column, you will also see a ratio to all existing Hive Power.
9. Payouts
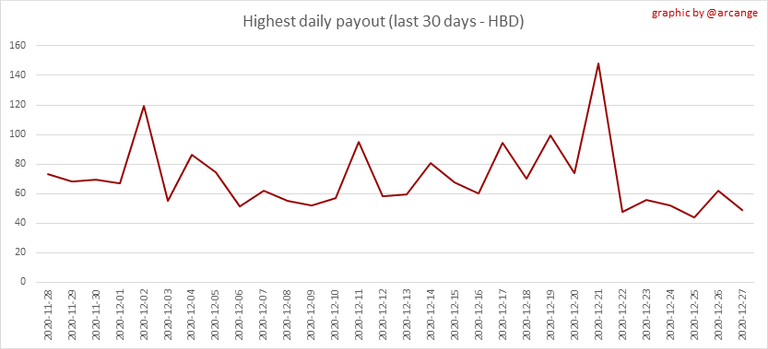
This graph shows the highest reward paid on a post (or comment) for the last 30 days.
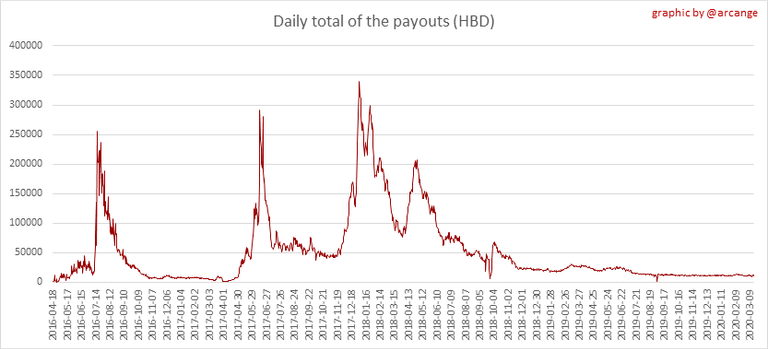 | 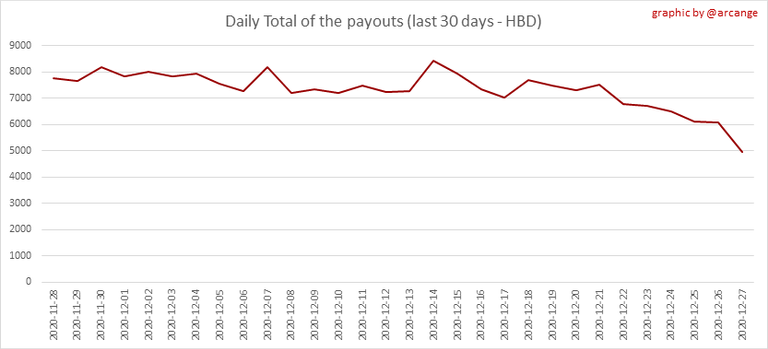 |
These graphs show the total of the distributed payout (posts and comments) for each day.
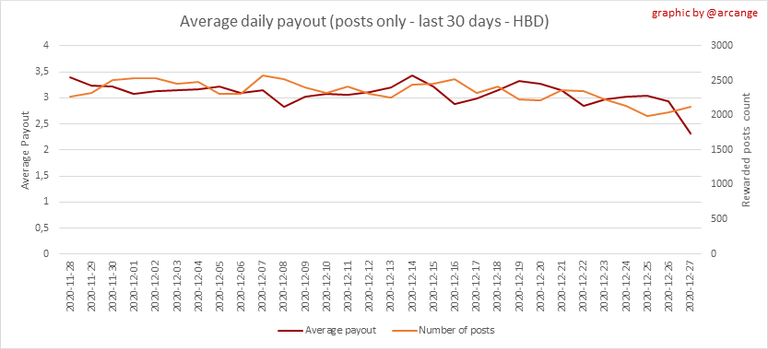 | 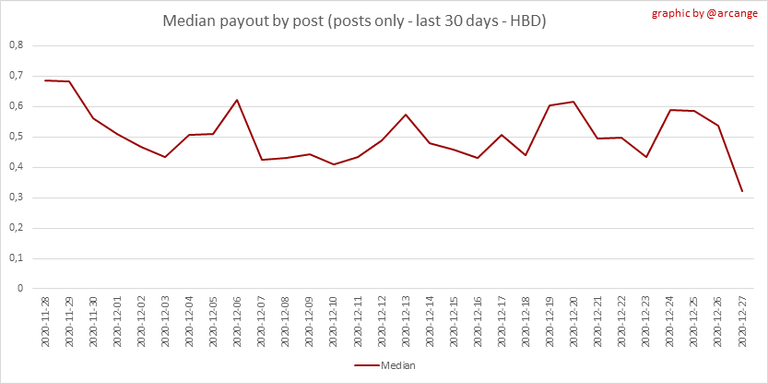 |
These graphs show the average and median payout per post for the last 30 days.
I hope you find those stats useful. If you would like to see different stats, feel free to drop me a comment. Your feedback is more than welcome.
Thanks for reading.
Discover my apps and services


Thank you for your statistics and contributions to the Hive Blockchain.
Thank you for your feedback @florian-glechner
BTW, the current HiveBuzz proposal will expire in a few days.
Do you mind casting your vote for the proposal renewal we made for 2021 so our team can continue with its work?
https://peakd.com/me/proposals/147
Thank you. Wish you all the best for 2021! Have a Happy New Year ✨🥂✨
Of course, I just supported the proposal with my vote. Thank you for doing so many cool projects on Hive. Happy New Year 2021 for you too.
Thank you for your support @florian-glechner, much appreciated! 👍
Thank you for statistics... I think i will start using PEAKD soon
Peakd è attualmente il mio front-end preferito. Spero che ti piaccia tanto quanto me.
IT
Caspita che italiano perfetto?! Hai usato un traduttore o sei italiano?
EN
Wow what a perfect Italian ?! Did you use a translator or are you Italian?
He He, non sono italiano, ma l'ho imparato sul lavoro (avevo una nonna in Italia).
Sfortunatamente, non ho più molte opportunità di praticarlo. Devo ammettere che a volte controllo quello che scrivo con un traduttore. 😞
Great! thanks for this answer. It was nice to know this.