Hive Financial Statistics – 2021.09.24

Welcome to the daily financial report about the Hive blockchain.
All the information presented in this report is based on the data collected from the blockchain until 2021-09-24 midnight UTC. This report aims to provide you with a clear view of what is happening on the Hive blockchain.
 Este post está traducido al español - aquí
 Dieser Beitrag ist ins Deutsche übersetzt - hier
 Une version en français de ce post est disponible - ici
1. Price
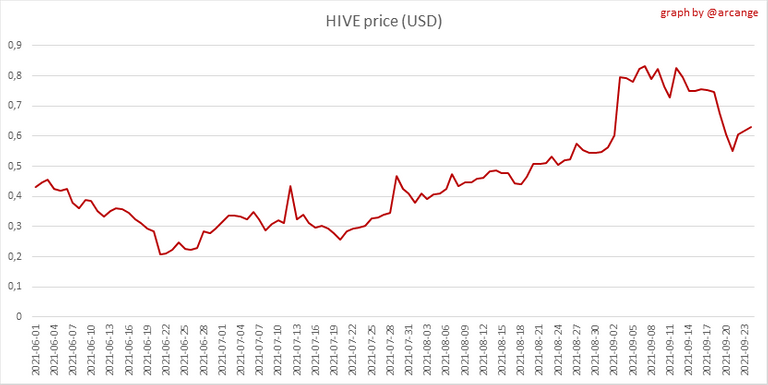 | 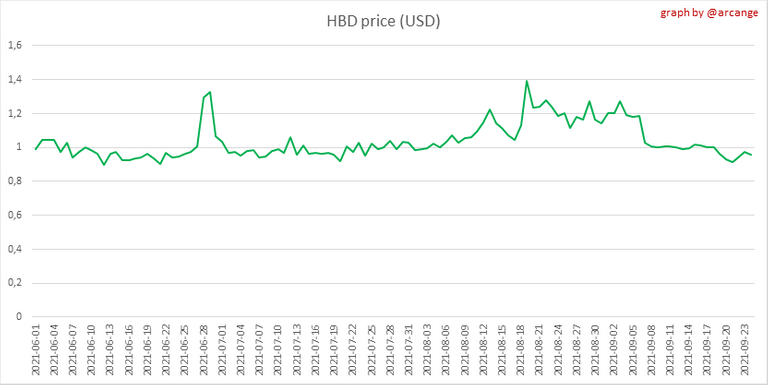 |
These graphs show the evolution of prices in USD for HIVE and HBD.
2. Supply

This graph shows the evolution of HIVE virtual Supply. The virtual supply is the sum of HIVE supply (liquid Or staked HIVE) and HBD supply (converted into HIVE).
The graph also displays the debt ratio (HBD supply / HIVE virtual supply). Keep in mind that since hardfork 24 funds in the treasury (@hive.fund HBD balance) don't count towards the HBD debt ratio.
 | 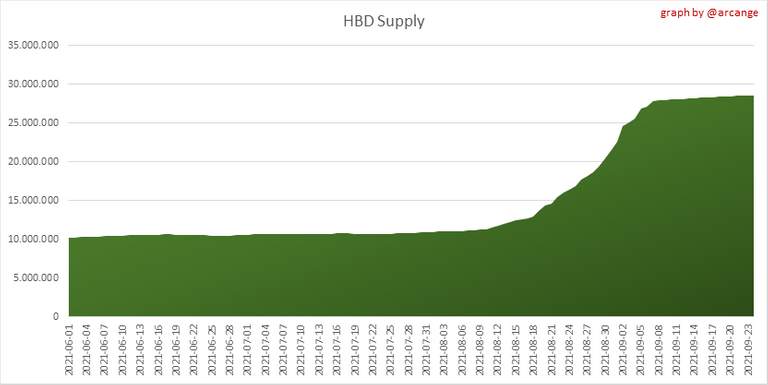 |
These graphs show the evolution of the HIVE Supply (both liquid and staked) and the HBD supply.
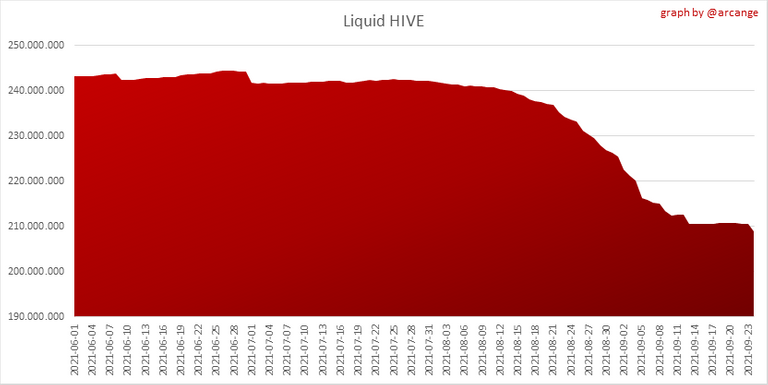 |  |
These charts show the evolution of the liquid HIVE and the staked HIVE (Hive Power).

This graph shows the overall Hive tokens distribution.
3. HBD Savings
Note: As of 2021-06-30 (HF25) interest is only paid for HBD which are stored in savings.

| Account | Deposit | Account | Withdrawal |
|---|---|---|---|
| @demotruk | 3,671.379 HBD | @globetrottergcc | 137.597 HBD |
| @hivevault | 1,750.000 HBD | @forykw | 110.000 HBD |
| @johnhtims.life | 1,342.000 HBD | @viper160891 | 82.679 HBD |
| @ecoinstant | 1,033.855 HBD | @frank1in | 50.000 HBD |
| @empress-eremmy | 150.000 HBD | @rachaeldwatson | 37.047 HBD |
| @orestistrips | 150.000 HBD | @wdougwatson | 29.361 HBD |
| @photovisions | 145.839 HBD | @rohansuares | 25.001 HBD |
| @franciscopr | 75.500 HBD | @stickupboys | 9.996 HBD |
| @hextech | 63.398 HBD | @oahb132 | 7.883 HBD |
| @agro-dron | 62.000 HBD | @tammyfit95 | 5.535 HBD |
This graph shows how much and how many accounts store HBD in savings. The table below shows the topmost HBD deposits and withdrawals of the day.

This chart shows the amount of interest paid each day for holding HBD and how many accounts received such interest.
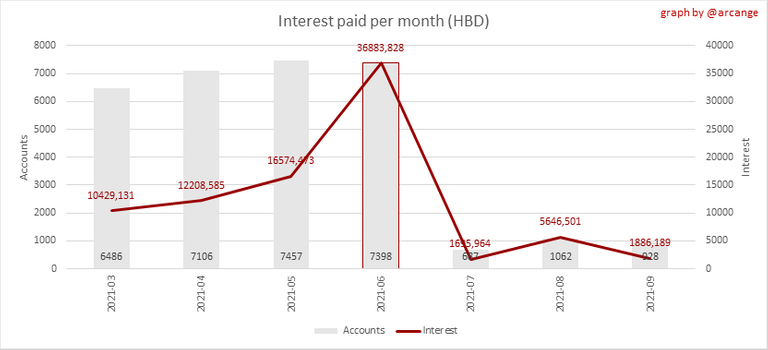
This chart is the same as the previous one, but data are grouped by month.
4. Balances

This graph shows the number of HIVE, both liquid and in savings, held by all accounts.
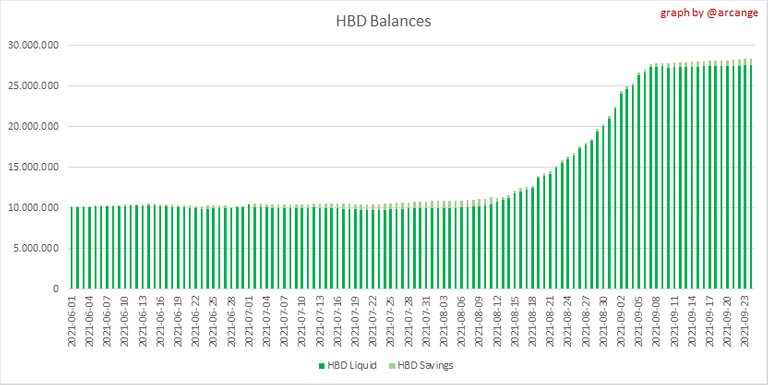
This graph shows the number of HBD, both liquid and in savings, held by all accounts.
5. Conversions
Note: As a reminder, conversion requests are only finalized after 3 days. It is only then that it is known exactly how many HIVE were burned in return for the HBD received at the time of the conversion request.

This graph shows the number of HIVE collateralized due to requests to convert HIVE to HBD over the past few days.
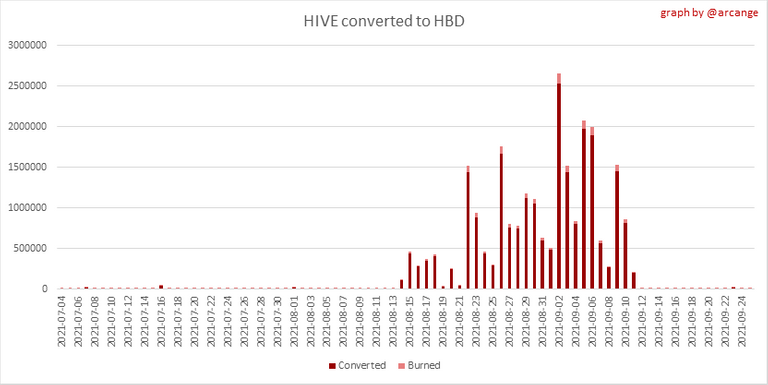 |  |
These graphs show the number of HIVE effectively used by the conversion process (HIVE converted and 5% HIVE fee which is burned) each day and month when requests to convert HIVE to HBD have been finalized.
 |  |
These graphs show the number of HBD burned, each day and each month, following requests to convert HBD to HIVE.
6. Powerup and Powerdown
| Date | Account | Amount |
|---|---|---|
| 2021-09-24 02:49:15 | @kevinwong | 75,275.623 HIVE |
| 2021-09-24 10:53:45 | @urun | 14,837.685 HIVE |
| 2021-09-24 04:12:45 | @drakos | 5,955.300 HIVE |
| 2021-09-24 07:39:03 | @devrim | 5,260.213 HIVE |
| 2021-09-24 12:40:39 | @josevas217 | 3,915.458 HIVE |
| 2021-09-24 01:30:45 | @jeanpi1908 | 3,402.144 HIVE |
| 2021-09-24 04:31:33 | @aceh-media | 3,000.207 HIVE |
| 2021-09-24 12:07:30 | @thegoliath | 2,600.219 HIVE |
| 2021-09-24 04:32:15 | @daveks | 1,950.217 HIVE |
| 2021-09-24 01:49:39 | @antoniojoseha | 1,677.701 HIVE |
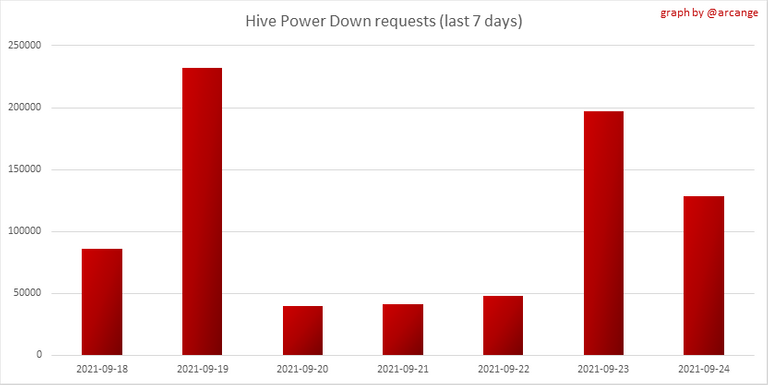
This graph and table show the amount of powerdown initiated over the last 7 days, and the largest initiated on this day.

| Account | Powerup | Account | Powerdown |
|---|---|---|---|
| @alpha | 1,503,229.732 HIVE | @zioland | 18,221.893 HIVE |
| @pfunk | 12,692.171 HIVE | @empoderat | 4,039.172 HIVE |
| @devrim | 5,259.910 HIVE | @someguy123 | 3,101.773 HIVE |
| @pandemichealth | 2,000.000 HIVE | @jarvie | 2,796.395 HIVE |
| @deanliu | 999.000 HIVE | @davidthompson57 | 2,774.103 HIVE |
| @barbarossastudio | 703.210 HIVE | @soyrosa | 2,715.116 HIVE |
| @psyberx | 495.001 HIVE | @cardanoguru | 2,590.678 HIVE |
| @joerhino | 444.000 HIVE | @sog13 | 2,538.643 HIVE |
| @mawit07 | 408.500 HIVE | @shralve | 2,255.325 HIVE |
| @igormuba | 377.400 HIVE | @deanliu | 2,028.727 HIVE |
This graph shows the daily HIVE power-up, power-down, and the resulting variation over the last 30 days. The table shows the topmost power-ups and power-downs of the day.
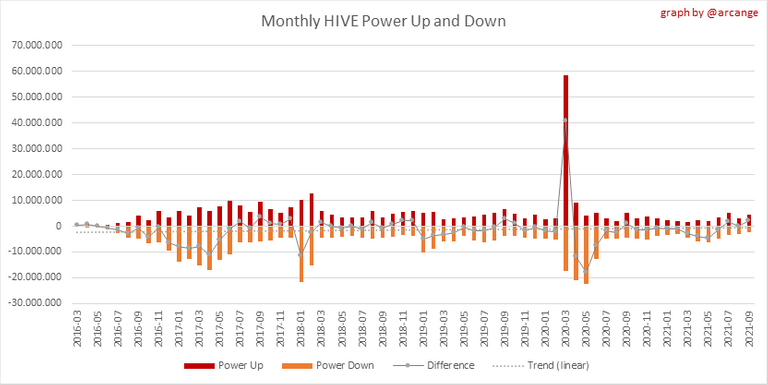
This graph shows the monthly HIVE power-up, power-down and the resulting variation.
Values for the last 3 months
| Period | Powerup | Powerdown | Difference |
|---|---|---|---|
| 2021-09 | 2,340,460.000 | 4,363,085.000 | 2,022,625.000 |
| 2021-08 | 3,144,598.000 | 3,212,814.000 | 68,216.000 |
| 2021-07 | 3,415,366.000 | 5,186,384.000 | 1,771,018.000 |
7. Transfers
These graphs show the volume (in USD) of HIVE and HBD transferred between accounts.
8. Exchanges
 |  |
These graphs show the amount and distribution of HIVE and HBD stored on the exchanges where they are listed.
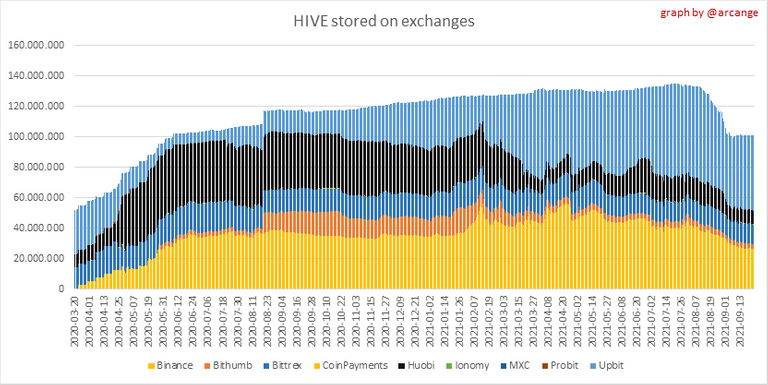 |  |
These graphs show the daily evolution of HIVE and HBD stored on the exchanges where they are listed.
I hope you find those stats useful. If you would like to see additional stats, feel free to drop me a comment. Your feedback is than welcome.
Thanks for reading.
Check out my apps and services


Thanks for the update
Posted Using LeoFinance Beta
Thank you @williamtboy
You are welcome
Posted Using LeoFinance Beta
Appreciate the work you put into this and the updates.
Thank you @joerhino
!PIZZA
!BEER
@arcange! I sent you a slice of $PIZZA on behalf of @eii.
Learn more about $PIZZA Token at hive.pizza (1/10)