Candlestick Patterns: How efficient is the Bullish Hammer Candlestick on BTC trading?
Following my post regarding my research and own assessment on how efficient particular candlestick patterns can be in trading, now is the turn to evaluate the Bullish Hammer .
A Bullish Hammer is a reversal candlestick pattern which is preceded by a downtrend. It used to indicate that although strong selling within the trend happened, buying entered the market and was strong enough to reverse the price higher, to close just above or below open price. Normally, it is used as the Reversal indication in a Bear market towards the Bullish.
Worth to say that the body of the candle should be small relative to the shadows. A general rule of thumb is that the shadow must be at least twice the size of the body.
My assessment keeps the following requirements as assumptions of the trade:
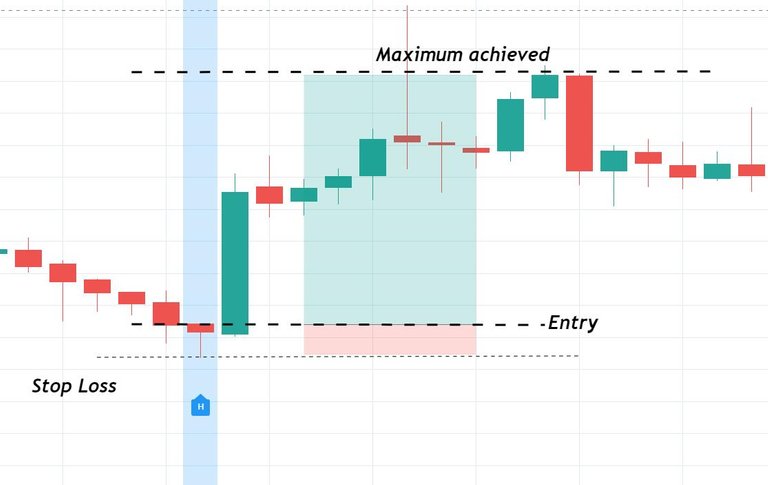
- Entry done on the opening of the next candle after identifying the pattern (see below "entry")
- VERY IMPORTANT: Risk of Loss limited always to the bottom of the green candle of the pattern (see below "Stop Loss"). The assumption is to set a stop loss always there, limiting the risk but it could be different depending on your risk management.
- The profitability of the pattern is taken as the maximum achieved before falling below the Stop Loss, of course, it depends on the trader to close position depending on other observations or targets but, here, I just want to see the potential of the indication not the real output.
In comparison with the Bullish Engulfing pattern , the Bullish Hammer has less recurrence so, as far as I have observed, there are less signals of this pattern placed within the same Time-frame and interval of time.
Actually, I have checked the 4h and 1 hour timeframes.
Assessment on the 4-Hours Chart since beginning of 2020.
As you can see, at least on the BITSTAMP market, there are only 3 signals found:
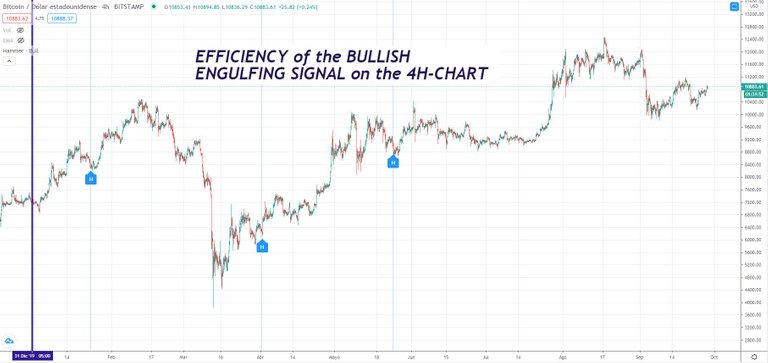
Not so many in order to have a proper population of study but, so far the results have been the following:
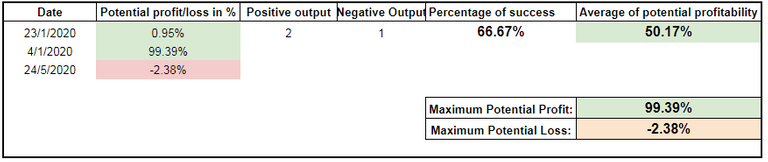
I keep the following data as the most important:
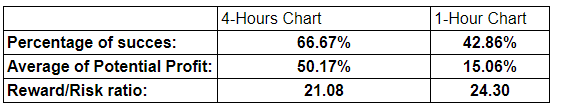
- Percentage of Success indicator: 66.67%
- Average of Potential profitability: 50.17%
Reward/Risk ratio: I would take the average potential profitability divided by the maximum potential loss (remember that is cut due to our stop loss assumption explained before) = 21.08 so, for every USD you put under risk you might obtain 21.08 USD
(Again, WE NEED MORE DATA in order to confirm this output, the fact that we have only 3 indications within the year does not provide certainty)
Assessment on the 1-Hour Chart since early May of 2020.
More indications on this time-frame however still poor in population.
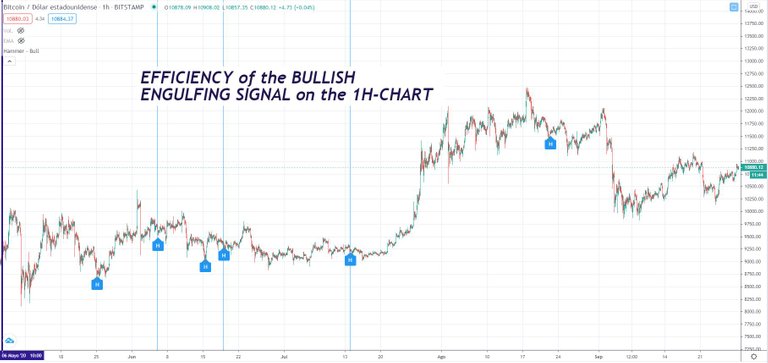
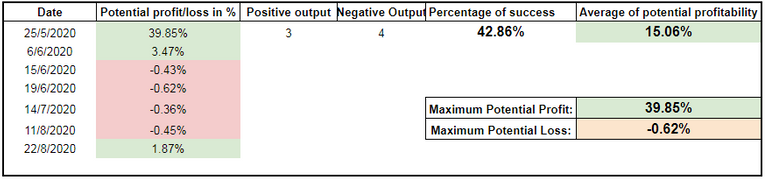
The results here appear less "enthusiastic" in terms of "reversal indication". The percentage of Success is only 42.86% , however, the potential profitability is still really good if a proper Stop Loss strategy, explained before in the assumptions, is taken.
Reward/Risk ratio: Taking the average potential profitability divided by the maximum potential loss (remember that is cut due to our stop loss rule from explained before) = 24.3 so, for every USD you put under risk you might obtain 24.3 USD which is an outstanding output from the assessment on this indicator.
Summary
Obviously here, the big question is if this candlestick indication remains being a good tool for day-trading. The answer in my opinion is that, due to the poor recurrence, it is not the best tool but it has really an outstanding REWARD/RISK ratio that indicates that it deserves to be used whenever appears.
This assessment just provide some more light on the statistical output of a famous pattern. I will try to complete the assessment with more data as soon as they appear.
Hope you have enjoy it.
Other Related Posts:
Candlestick Patterns: How efficient is the Bullish Engulfing Pattern on BTC trading?
I'm sharing only my quick trading Ideas here, not financial advice at all ;-)
*Disclaimer: This is just my personal point of view, please, do your own assessment and act consequently. Neither this post nor myself is responsible of any of your profit/losses obtained as a result of this information.


@tipu curate
Upvoted 👌 (Mana: 18/27) Liquid rewards.
Thanks!
No me acaba de gustar este indicador, necesita mas datos
A ver, yo no soy de guiarme mucho por velas mas que utilizandolas como posibles confirmaciones que por si solas ni pongo ni quito 1 solo Satoshi.
Ademas, me parecen un elemento muy facilmente manipulable, ya que el tipico latigazo de ida y vuelta como un rayo para limpiar stops o incluso liquidar posiciones, que ha habido el ultimo mes 3 movimientos me han parecido muy heavys en (Binance 2 y otro en Coinbase que yo haya visto).
Y aunque no con varios cientos de $ de recorrido como los otros, hoy a la mañana se ha dado uno muy "estrategico" (yo soy muy conspitradernoico xD) o ha habido mucha casualidad...
VELAS DE 1 HORA
EN VELAS DE 4H SE VE ASI!!
Y AHORA MIRA EN VELAS DE 1 MINUTO
Esto se da 5 minutos antes y no queda ni medioparecida esa vela, y si se da 5 minutos despues de las 8, ni rastro. Casualidad? Si, casualidad que psaba un HDP por ahi xD
Esa vela suele ser super-bearish... si, cada vez hay mas HDP manipulando el mercado...por eso es bueno sacarle "cuanto cierto hay" con respecto a esos patrones.
Yo tanto cosas cono esta como ondas de Elliot, para poder ver descifrar lo mejor posible lo que uno ve, necesita recurrir al max de info sobre lo que esta viendo. Velas de 1 min... Yo en zonas o momentos creo pueden ser decisivas recurro, solo puntualmente, porque uno pude volverse loco si no xD. Y este mercado es un muñecop de trapo para cualquier banco por ej...
Esto fue enBinance, un 2,03% es una vela de 5min pero yo estaba mirando la pantalla en ese momento, si tubieras velas de 1 segundo lo verias igual. Me parece imposible se el resultado de la masa operando y no el mismo quien hizo un vendo compro seguido para hacer limpia de posiciones. 10 septiembre 2:45H 10278$ cierre de la vela. Adivina hacia donde fue despues el precio... 9 dias dseguidos de subida hasta 11200$ casi.
https://twitter.com/thecryptorunner/status/1310593929625186306
Another great educative post, @toofasteddie! I do like the candlestick analysis, but when I am trading I use it as a complementary to my TA.
Posted Using LeoFinance Beta
Fully agree, this is just another tool to add in our Bag of TA tools, the combination of them is our "arsenal" in order to take decisions.
Well said!