Splintercards.com | A platform that has it all about "Splinterlands" (Part 1) [EN-ES]
Cover created in Canva

Hace practicamente 2 semanas publique un post acerca de la plataforma “Splintertools.io”, donde explicaba cómo utilizarla para poder practicar y mejorar nuestras alineaciones de batalla, con el fin de aumentar nuestras probabilidades de ganar una batalla perdida, sinceramente es una gran herramienta que me ha ayudado a mejorar en mis estrategias y en la forma en como interpreto y juego las reglas, sin embargo, en esta oportunidad les traigo algo muy diferente, una plataforma donde practicamente podemos encontrar de todo un poco y que, nos ayudara tanto en la jugabilidad, como en algunos análisis con especto al mercado de las cartas, su precio y otras herramientas.
En este post, solo me enfocare en la pestaña llamada “Tools”, donde encontraremos muchas opciones interesantes para nuestro análisis, sin embargo, como esta plataforma es muy completa, explicare cómo funciona, una de las opciones más utilizadas llamada “List Price Analisys”, siendo esta la primera parte de una seria de post que realizare sobre dicha plataforma para que aprendan a utilizarla correctamente. Atención, porque lo que explicare, puede ser realmente útil para obtener ganancias en el juego tan solo comprando y vendiendo cartas en el mercado sin la necesidad de jugar.
Si quieres saber más, quédate para que aprendas a ver el mercado de cartas en “Splinterlands” de una manera más analítica y profesional.

¿Qué es “Splintercards”?

Comenzare por lo más básico, aunque no ahondare mucho en lo que es la plataforma, porque, ella se explica por sí misma y es muy básica, sin embargo, la cantidad de información que brinda la misma es realmente útil y puede ayudarnos de muchas maneras, para poder filtrar y poder incluso por medio de esta ganar algo de dinero en el mercado.
Splintercards.com es una plataforma creada por @tehox, el cual ha realizado un trabajo excepcional como creador de esta increíble herramienta que tanto ha ayudado a muchos usuarios incluyéndome, destacando que la uso frecuentemente para monitorear los precios de las cartas y otras cosas. Splintercards, nos brinda un sinfín de herramientas con las que podemos analizar el mercado de las cartas y monitorear los precios de los principales “Items” vendidos en el juego de forma rapida, también podremos observar todas las cartas existentes en el juego, en conjunto con sus reglas y habilidades, algo realmente completo.
Para poder acceder a esta plataforma, solo debes hacer click en el enlace que dejare a continuación y te llevara directamente hacia ella:

La herramienta “List Price Analisys”
En esta primera parte del post, analizare uno de los apartados más útiles de “Splintercards.com”, al menos en mi opinión, estoy hablando de “List Price Analisys”, donde podremos monitorear los precios de las cartas en el mercado con varias métricas bastante interesantes que nos permitirán analizar si en realidad es una buena oportunidad para comprar una carta o en su defecto esperar a que el mercado de dicha carta haga un retroceso en su precio con la finalidad de comprar más barato y poder vender caro en un futuro. Esto es a groso modo la forma en que se utiliza esta opción, sin embargo, primero explicare algunos filtros necesarios, para que puedan entender de qué forma filtrar las cartas de su elección a las que les quieran hacer seguimiento:
Como utilizar el “Filtro”
Sinceramente no hay mayor complejidad en su uso, sin embargo, para que todos lo entiendan, especialmente los nuevos, lo explicare de forma muy sencilla:
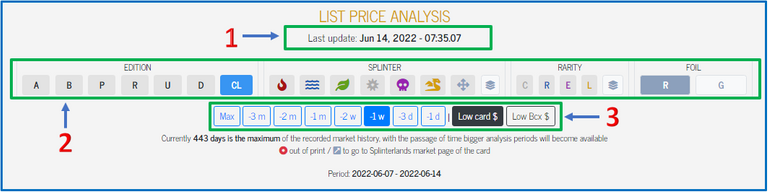
1.Esta opción es importante tenerla presente, ya que nos muestra la fecha y la hora de la última actualización de los precios, así que, si queremos analizar correctamente los precios de las cartas, lo correcto es tener presente que, el día en que vayamos a analizar los precios la hora no se encuentre muy lejos de lo que queremos, ya que, como es un mercado que funciona 24/7, los precios fluctúan todo el tiempo.
2.En este parte, lo unico que debemos observar y elegir es que edición queremos buscar, a que “Splinter” pertenece, cual es la rareza de la carta y por último si esta es regular o la queremos buscar en su versión dorada.
3.Esta opción es muy interesante, ya que podremos elegir el día, las semanas o los meses en que ha fluctuado el precio de una carta, ademas de elegir que, aparezcan bien sea por precio en dólares más bajo, por el BCX más bajo. Personalmente la dejo por defecto, donde elijo ver los precios en temporalidad de 1 semana y por el valor en dólares de la carta más bajo.
Cuadro de análisis de precio
Es aquí donde las cosas se ponen interesantes y es donde podremos analizar de una vez por todas el precio de nuestra carta objetivo, ademas, teniendo esto en cuenta, explicare cada columna detallada en dicho cuadro:
Monsters | Summoner
En esta columna veremos el nombre de la carta, ademas justamente al lado, podremos ver a que edición pertenece, la cual es señalada con una letra mayúscula, en este caso la letra “C” de “Chaos Legion”, también veremos a que “Splinter” pertenece la carta, y por último que tipo de rareza tiene la carta. Esto nos ayudara a ubicarnos, para conocer que cartas estamos analizando, por supuesto, previamente antes de ver este cuadro, en el filtro explicado anteriormente debemos seleccionar lo que deseemos investigar.
Price $ (1 week ago | Last | DEC | Trend | Min/Max)
En esta columna especifica, podremos ver otras opciones adicionales que derivan de esta, las cuales son las más importantes de nuestro análisis, ademas en estas, aprovechare de explicar la forma en que yo personalmente la utilizo, sin embargo, una vez ingresen y la utilicen, podrán utilizarla de la forma que deseen para poder sacarle provecho:
1 week ago: En esta columna veremos el ultimo precio de la carta que deseemos tener como objetivo de compra o venta, hace una semana, lo que quiere decir que, hace una semana atrás, el 7 de junio específicamente, el “Doctor Blight”, costaba aproximadamente unos $86.989, tomando en cuenta que es una carta del tipo “Legendaria” regular
Last: Esta es una de las columnas más importantes, ya que refleja el ultimo precio en el que estuvo la carta al momento de actualizar la información en la misma, lo que quiere decir que, en este caso, el “Doctor Blight”, paso de costar $86.989 a $74.000, por lo que, en temporalidad de una semana que es donde estamos analizando, el precio ha bajado exactamente unos $12.989. Ya en este momento vemos un claro retroceso, una oportunidad para comprar, mas no para vender.
DEC: Esta columna no tiene nada en particular, sin embargo, refleja la cantidad de DECS que costaría la carta en base al último precio registrado según la última actualización, esto quiere decir que, como el ultimo precio es de $74.000, la cantidad de DECS para pagar este momento según esta columna es de 94.811 DEC.
Trend: Esta es otra de las columnas más importantes de todo este cuadro y una en la que personalmente me baso para tomar mis decisiones de compra o venta en el mercado, las cuales me han funcionado para obtener ganancias. Lo que refleja es el porcentaje de “Subida o Caída” que ha tenido la carta en temporalidad de una semana, lo que quiere decir que, como la carta ha bajado de precio desde los $86.989 a los $74.000, esto representa una caída del 14.9%, es por esta razón que, el porcentaje de refleja con un color “Rojo”, si esto fuera lo contrario, el porcentaje seria de color “Verde”, representando una subida en su precio.
Min/Max: Esta columna en resumen nos muestras el precio mínimo y maximo que ha tenido la carta en el transcurso de la semana que estamos analizando, lo que quiere decir que, en la última semana desde el 7 de junio hasta el 14 del mismo mes, la carta ha estado en un mínimo de $77.400 y en un maximo de $86.989. Si se dan cuenta, el precio actual según la última actualización, se encuentra en los $74.000, como ven es menor a los $77.400 mostrados aquí, así que, la interpretación correcta de esto es que, hay una fuerte presión bajista, lo que me lleva a decir que, muchos jugadores están vendiendo esta carta, puede que sea debido al declive del mercado de “Criptomonedas”, ya que, si se fijan, la mayoría de las cartas reflejan bajas en sus precios con porcentajes todos de color “Rojo”.
1 Week AVG
Estas columnas forman parte del mismo cuadro, sin embargo, reflejan una información distinta, pero, que se complementa con todo el análisis del precio de las cartas que tengamos como objetivo, bien sea para comprar o para vender, aunque, debo aclarar que realmente no lo uso para mi análisis, ni tampoco lo tomo en cuenta para comprar y/o vender.
Lo que este refleja, es el valor promedio de la carta en “dólares” con respecto a la última semana que estanos analizando, es algo muy parecido a una “media móvil” que calcula el periodo de acuerdo al tiempo que le otorguemos, así que, en este caso, el valor de la media con respecto al último precio de hace una semana es de $81.919, bajo un porcentaje de 9.7% con respecto al “Doctor Blight”. Claramente con estos datos, podemos hacernos una idea de la tendencia que posee el precio de la carta, como si estuviéramos observando una gráfica.
Por ultimo y no menos importante, en esta ultima columna, podremos hacer click en el icono de la flecha blanca con fondo gris, para dirigirnos directamente a la plataforma de “Splinterlands” justo en el mercado de la carta que estos viendo en ese momento.
Detalles importantes de “List Price Analisys”
Algo que debemos tener en cuenta es que, todos estos datos nos pueden ayudar a tomar una decisión de compra o venta en el mercado, sin embargo, debemos tener paciencia si es que decidimos comprar o vender una carta, ya que, nuestro precio objetivo de ventas o de compras, no llegara de un día para otro, esto hay que tenerlo claro, ya que, a pesar de que la plataforma es sumamente útil con estos datos, el tiempo con que el precio suba o baje dependera de los mismos jugadores (Actores del Mercado), así que, la paciencia es vital para tener éxito con esta práctica.
Realizando un buen análisis, podremos obtener buenas ganancias con la compra y venta aunque lleve tiempo en cumplirse, lo que nos puede traer ganancias en el corto, mediano y largo plazo, sin jugar el juego como tal, esta herramienta es para aquellos que tienen un perfil más de inversionista, en lo personal, me gusta el juego y su jugabilidad, más todas sus características, así que me divierte jugar y ganar, pero también lo veo como un negocio, así que lo observo también desde esta perspectiva.
Consideraciones finales
Espero que esta herramienta les funcione para que puedan calcular más o menos el precio con que quieran comprar o vender una carta, ver si está muy barata o en su defecto muy cara. Para otra oportunidad, abarcare más opciones que posee esta grandiosa plataforma y que nos puede ayudar de muchas maneras a que aprendamos sobre el juego y sobre algunas estrategias, ademas, también observaremos varias opciones, donde podremos monitorear los precios del mercado.
Sin más por el momento, nos vemos en la próxima guerreros.

Almost 2 weeks ago I published a post about the platform "Splintertools. io", where I explained how to use it to practice and improve our battle alignments, in order to increase our chances of winning a losing battle, honestly it is a great tool that has helped me improve my strategies and the way I interpret and play the rules, however, this time I bring you something very different, a platform where we can find practically everything a little and that will help us both in the gameplay, as in some analysis regarding the card market, its price and other tools.
In this post, I will only focus on the tab called "Tools", where we will find many interesting options for our analysis, however, as this platform is very complete, I will explain how it works, one of the most used options called "List Price Analisys", being this the first part of a series of post that I will make about this platform so you can learn how to use it correctly. Attention, because what I will explain, can be really useful to get profits in the game just buying and selling cards in the market without the need to play.
If you want to know more, stick around to learn how to view the card market in "Splinterlands" in a more analytical and professional way.
What is "Splintercards"?
I will start with the most basic, although I will not delve much into what the platform is, because it is self-explanatory and very basic, however, the amount of information it provides is really useful and can help us in many ways, to be able to filter and even through this to earn some money in the market.
Splintercards.com is a platform created by @tehox, which has done an exceptional job as the creator of this incredible tool that has helped many users including me, highlighting that I use it frequently to monitor the prices of cards and other things. Splintercards, gives us endless tools with which we can analyze the card market and monitor the prices of the main "Items" sold in the game quickly, we can also observe all existing cards in the game, along with their rules and abilities, something really complete.
To access this platform, just click on the link below and it will take you directly to it:
The "List Price Analisys" tool
In this first part of the post, I will analyze one of the most useful sections of "Splintercards.com", at least in my opinion, I am talking about "List Price Analisys", where we can monitor the prices of the cards in the market with several interesting metrics that will allow us to analyze if it is really a good opportunity to buy a card or otherwise wait for the market of that card to make a setback in its price in order to buy cheaper and be able to sell expensive in the future. This is roughly the way in which this option is used, however, first I will explain some necessary filters, so that you can understand how to filter the cards of your choice that you want to follow up:
How to use the "Filter"
Honestly, there is no major complexity in its use, however, so that everyone understands it, especially the new ones, I will explain it in a very simple way:
1.This option is important to keep in mind, since it shows us the date and time of the last price update, so, if we want to correctly analyze the prices of the charts, the right thing to do is to keep in mind that, on the day we are going to analyze the prices, the time is not too far from what we want, since, as it is a 24/7 market, prices fluctuate all the time.
2.In this part, the only thing we must observe and choose is which edition we want to look for, which "Splinter" it belongs to, which is the rarity of the card and finally if it is regular or if we want to look for it in its golden version.
3.This option is very interesting, since we can choose the day, the weeks or the months in which the price of a chart has fluctuated, as well as choose that, they appear either by lowest price in dollars, by the lowest BCX. Personally I leave it by default, where I choose to see the prices in temporality of 1 week and by the lowest dollar value of the chart.
Price analysis table
This is where things get interesting and where we will be able to analyze once and for all the price of our target chart, and with this in mind, I will explain each detailed column in the chart:
Monsters | Summoner
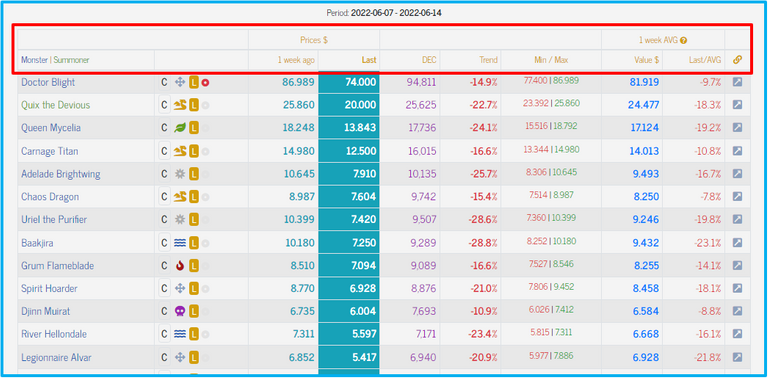
In this column we will see the name of the card, also right next to it, we will be able to see which edition it belongs to, which is marked with a capital letter, in this case the letter "C" for "Chaos Legion", we will also see which "Splinter" the card belongs to, and finally what type of rarity the card has. This will help us to locate us, to know which cards we are analyzing, of course, previously before seeing this table, in the filter explained previously we must select what we want to investigate.
Price $ (1 week ago | Last | DEC | Trend | Min/Max)
In this specific column, we can see other additional options that derive from this, which are the most important of our analysis, also in these, I will explain how I personally use it, however, once you enter and use it, you can use it the way you want to take advantage of it:
1 week ago: In this column we will see the last price of the card that we wish to have as a buy or sell target, one week ago, which means that, one week ago, specifically on June 7, "Doctor Blight", cost approximately $86,989, taking into account that it is a regular "Legendary" type card.
Last: This is one of the most important columns, since it reflects the last price at which the chart was at the time of updating the information in it, which means that, in this case, the "Doctor Blight", went from costing $86,989 to $74,000, so, in the time span of one week, which is where we are analyzing, the price has dropped exactly $12,989. Already at this moment we see a clear setback, an opportunity to buy, but not to sell.
DEC: This column has nothing in particular, however, it reflects the amount of DECS that the letter would cost based on the last price recorded according to the last update, this means that, as the last price is $74,000, the amount of DECS to pay at this time according to this column is 94,811 DEC.
Trend: This is another of the most important columns in this chart and one that I personally rely on to make my buy or sell decisions in the market, which have worked for me to make profits. What it reflects is the percentage of "Rise or Fall" that the chart has had in one week, which means that, as the chart has fallen in price from $86.989 to $74.000, this represents a fall of 14.9%, it is for this reason that the percentage reflects with a "Red" color, if this were the opposite, the percentage would be of "Green" color, representing a rise in its price.
Min/Max: This column in summary shows the minimum and maximum price that the chart has had during the week we are analyzing, which means that in the last week from June 7 to June 14, the chart has been at a minimum of $77,400 and a maximum of $86,989. If you notice, the current price according to the last update, is at $74,000, as you see it is lower than the $77,400 shown here, so, the correct interpretation of this is that, there is a strong downward pressure, which leads me to say that, many players are selling this card, it may be due to the decline of the "Cryptocurrency" market, since, if you notice, most of the cards reflect lows in their prices with percentages all in "Red" color.
1 Week AVG
These columns are part of the same table, however, they reflect a different information, but, which is complemented with all the analysis of the price of the cards that we have as a target, either to buy or to sell, although, I must clarify that I do not really use it for my analysis, nor do I take it into account to buy and/or sell.
What this reflects, is the average value of the chart in "dollars" with respect to the last week we are analyzing, it is something very similar to a "moving average" that calculates the period according to the time we give it, so, in this case, the value of the average with respect to the last price of a week ago is $81.919, under a percentage of 9.7% with respect to the "Doctor Blight". Clearly, with this data, we can get an idea of the trend of the price of the chart, as if we were looking at a graph.
Last but not least, in this last column, we can click on the white arrow icon with gray background, to go directly to the "Splinterlands" platform right in the market of the card we are currently viewing.
Important details of "List Price Analisys".
Something to keep in mind is that all this data can help us make a decision to buy or sell in the market, however, we must be patient if we decide to buy or sell a card, since our target price of sales or purchases, will not arrive overnight, this must be clear, because, although the platform is extremely useful with this data, the time with the price up or down will depend on the same players (market players), so patience is vital to succeed with this practice.
Making a good analysis, we can get good profits with the purchase and sale even if it takes time to be fulfilled, which can bring us profits in the short, medium and long term, without playing the game as such, this tool is for those who have a more investor profile, personally, I like the game and its gameplay, plus all its features, so I enjoy playing and winning, but I also see it as a business, so I look at it also from this perspective.
Final considerations
I hope this tool works for you to calculate more or less the price you want to buy or sell a card, to see if it is very cheap or very expensive. For another opportunity, I will cover more options that has this great platform and that can help us in many ways to learn about the game and some strategies, in addition, we will also see several options, where we can monitor market prices.
Without further ado, see you next time warriors.


If you are new, I invite you to register in this LINK

Proud Member of "Shield of Glory".

Join the Discord Official community server in English
https://twitter.com/leninmiguel21/status/1537698877599514625
The rewards earned on this comment will go directly to the people(@lenonmc21) sharing the post on Twitter as long as they are registered with @poshtoken. Sign up at https://hiveposh.com.
Thank you for this great review!