IPL 2021 Powerplay stats
T20 head to head continues to leverage its database of details cricket statistics to bring you up to date and unique data on the world's biggest T20 franchise league.
We've now released data on both batting and bowling stats in the the powerplay at both an individual and team level and they make for some fascinating reading.
Of course, the very different conditions that we've seen at the 2 venues used to date do account for some of the discrepancies on show in the graphs below and as the teams now begin to move away from their initial bases it will be fascinating to see how these stats change.
Get full and regularly updated powerplay stats for IPL 2021 on our site
Graph 1 - Run rate in the powerplay by IPL Team
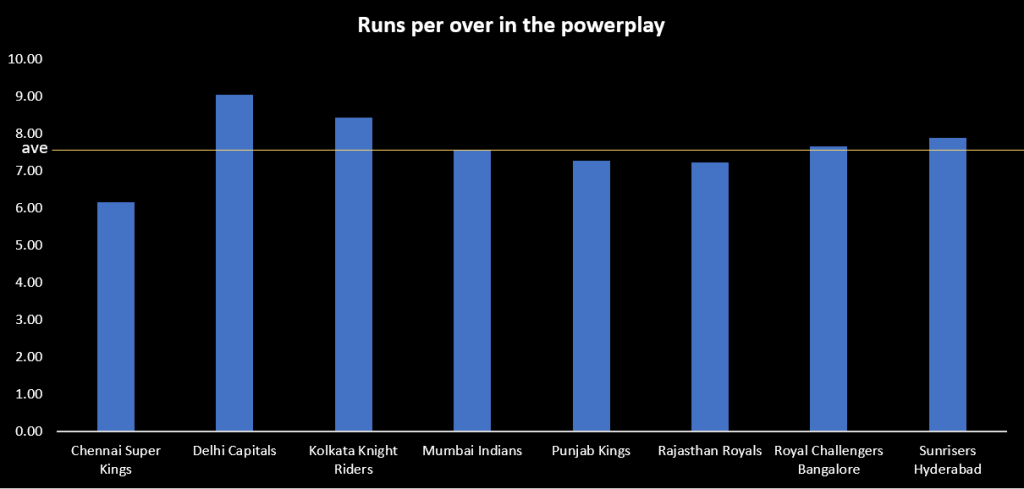
Key points - DC have been the best starters to an innings which is even more impressive when you consider all 3 other teams playing at the Wankhede have generally struggled in the powerplay
Graph 2 - Economy rate in the powerplay by IPL Team
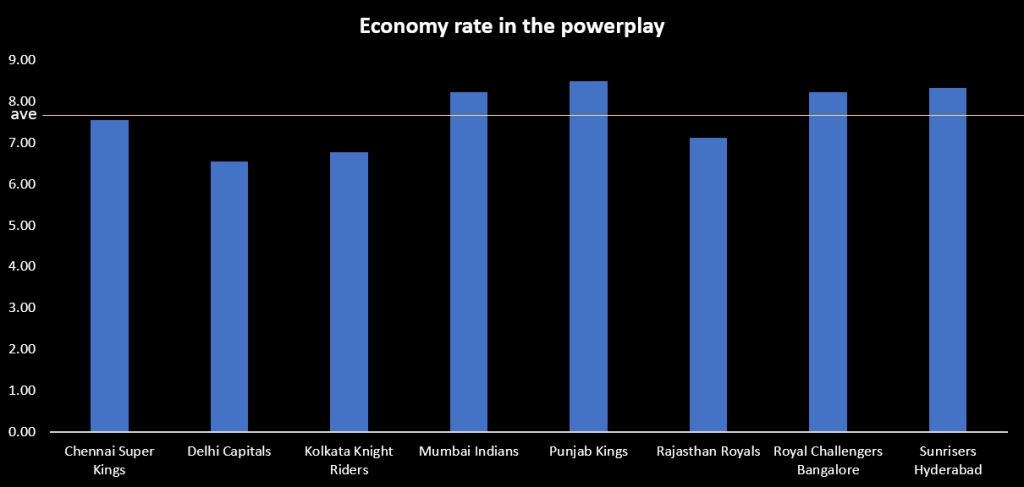
Key points - We can see the different approaches that sides are taking at both venues. Attack in the powerplay is very much a neccesity at Chennai whereas survival in Mumbai is the key early on.
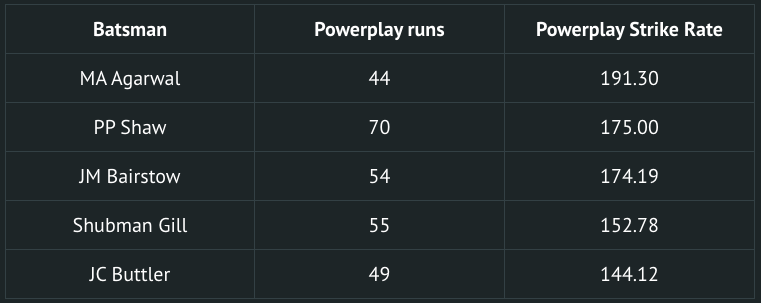
On an individual basis these batsmen have been the top performers in the powerplay (min 30 runs scored in PP)
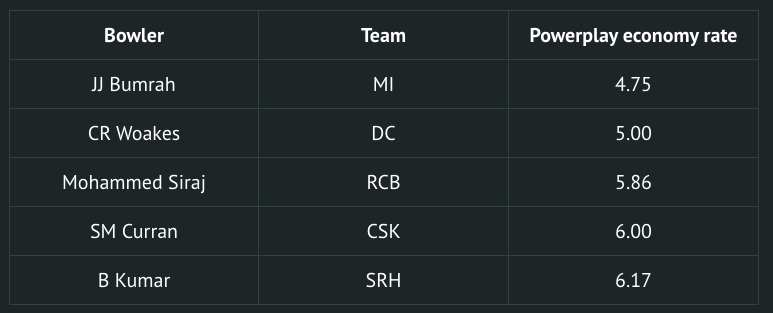
Whereas these bowlers have kept it tight up front (min 20 balls bowled in the powerplay)