What is DAX (DATA ANALYSIS EXPRESSIONS)
Data Analysis Expression language or DAX, was originally released with Power Pivot in Excel in 2010 by Microsoft. It’s a functional language that is very similar to excel, as you would expect as it was part of the excel tools. Its initial basic function was to allow excel users solve more complex business problems.
Now, not only is DAX used in Power Pivot but it is also the language used in Analysis Services tabular and Power BI.
So I mentioned DAX is similar to Excel but there are some major differences. Excel works on cell references and ranges of cells. DAX does not. DAX works on tables and subsets of tables of data.
In addition to the suite of Excel functions that work in DAX, DAX also has many additional and more powerful functions that are not available in Excel. Functions or Expressions that make the DAX language so much more exciting than Excel.
When we say DAX is a functional language we mean that the language makes a call to a function, which is known as an expression in DAX. The result from this expression can then be used in a call to another function. If you are familiar with nesting in Excel, commonly used with IF statements, well you could say it’s something similar to that.
Data Types in DAX
DAX supports a number of different data types; a few more than excel.
Integer Which is just a whole number
Decimal Which is just a fraction of a number
Currency is a combination of an integer and decimal
Date and Time is also a combination of an integer and decimal. Very much like in Excel DATE and time are just a number and if you are familiar with date and time in Excel then you know that data is represented by a whole number and time is represented by a decimal number.
Boolean this is a true or false result
String is text
Binary is an object such as a file or an image
DAX Syntax
DAX syntax is not that difficult, but it does differ to Excel. We mentioned earlier that Excel works with cell references or ranges, but DAX works with tables and columns in a table
Let’s look at a simple DAX expression
= DISTINCTCOUNT (
‘Sales’[customer_id]
)
Like Excel, DAX always starts with an equals sign (=)
After the equal sign DAX then calls an Expression, which is a function or a formula. In this example we have called the DISTINCT expression which will count the distinct values of a selected column.
The table name is shown in the quotes (‘Sales’). Now these quotes can be left out if the table name does not contain any special characters. After this we reference the column in the table contained within []. In this example we have selected the customer id column. The result for this DAX expression will give us the number of unique customers that we have sold to.
DAX Calculations- You Need to KNOW This...
There are two types of DAX calculations. A calculated column and a measure. Both have their uses and their benefits.
It is also worth bringing up at an early stage that DAX calculations are carried out in two contexts.
- A row context, which is the rows or selected rows of a table
- A filter context which is defined by the filters on a pivot table or visualisation.
Calculated Columns and Measures
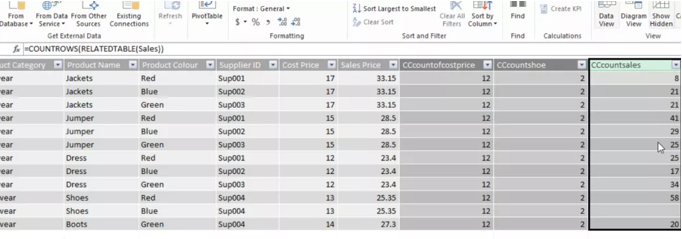
There are two type of calculations in DAX. There is a calculated column and there is a measure. Both of these have different behaviors and different uses so it is worth talking about them a little.What are Calculated Columns?
Calculated columns are calculated at the time of input and are refreshed only when the model is refreshed. One drawback is that calculated columns use RAM. If you have a few billion rows, it will use a lot of RAM, so only use them when you have to. When you carry out a calculated column, it is calculated row by row, at row level. Understanding row level and filter level are important when you get into more complex DAX.A calculated column can be used as a row header or a slicer to analysed data in pivot tables and visualisations. It can also be used as a value within a pivot table or a visualisation.
What are Measures?
Measures, known as calculated fields in Power Pivot 2013 are calculated at report level, they are not stored in the data model. They are also calculated at report level on an aggregate value. That means that measures are not calculated at row level like calculated columns. But when they are used in a pivot table or visualization. Measures are used as valued fields. They cannot be used to slice and dice data with because only fields (columns) from your data set can be used.
In a measure you need to define the row. The row context is not automatically defined when creating a measure. To define the rows in a measures you will need to add an aggregate such as SUM, around the columns in the expression. The most common used aggregate values used in DAX as with Excel are SUM, AVERAGE, MIN & MAX. If your measure returns a table, you will also to use an iterator to define the row. Iterators would include SUMX & COUNTX which we will look at in the next section.
So when do you use a calculated column or a measure?
Well there are no real hard and fast rules. If you are coming from an Excel background, you might think it is best to expand the table and create a calculated column. But Excel and DAX are different. Measures have the ability to do things that calculated columns cannot do such as calculate the average sales per day or change v’s prior year.
Sign up for my newsletter – Don’t worry, I wont spam. Just useful Excel and Power BI tips and tricks to your inbox
Sign Up Now
In return for this Tip -What is DAX (DATA ANALYSIS EXPRESSIONS) - I ask that you share this post or the video with your friends and colleagues
Learn and Earn Activity - What is DAX?
To earn Steem rewards on this post, in the comments section below answer the following questions:
Where can DAX be used?
What is the difference between a calculated column and a measure?
If you have any questions, comments or more efficient steps, please do drop me a comment below. It might also be worth a reward!!!!!

Posted from my blog with SteemPress : http://theexcelclub.com/what-is-dax-data-analysis-expressions/
You got a 54.03% upvote from @spydo courtesy of @theexcelclub! We offer 100% Payout and Curation. Thank you.
Hello spydo!
Congratulations! This post has been randomly Resteemed! For a chance to get more of your content resteemed join the Steem Engine Team
Congratulations @theexcelclub! You have completed the following achievement on the Steem blockchain and have been rewarded with new badge(s) :
You can view your badges on your Steem Board and compare to others on the Steem Ranking
If you no longer want to receive notifications, reply to this comment with the word
STOPVote for @Steemitboard as a witness to get one more award and increased upvotes!