Tips for Analyzing Categorical Data in Excel
It is often necessary to analyze different data types in Excel, including analyzing categorical data in Excel. Having opened up some blog posts to questions from you, the reader and Excel learner, Jeff sent me on this question:
" I am new to Excel and using it to start my learning journey in basic data analysis. Do you have any tips to quickly analyse categorical data in Excel?"
Well Jeff, the answer is yes, I do have some tips and I am opening the comments section to other Excel users to also add their tips and earn some #steem if they help you.
What is Categorical Data?
For those of you that are not familiar with data types.
Categorical data is also known as qualitative data and it can be further divided into two categories:
Ordinal Data – examples of ordinal data include Rank or Satisfaction. Ordinal values have a meaningful order but the intervals between the values might not be equal. Ordinal data is best represented with frequencies and proportions and sometimes the mean. Ordinal data is best visualised with a bar or column chart.
Nominal Data – this information includes descriptions or labels with no sense of order, such as Sex, Colour, or Preferred type of something. They can be stored as a word or text or given a numerical code, however, the numbers would not imply any order. To summarize nominal data, frequency or % are commonly used. The mean or average value for nominal data cannot be calculated. Nominal data is most often visualized using a pie chart or column/bar chart.
Analyzing Categorical Data in Excel with Pivot Tables
My big tip for you Jeff is how to analyze categorical data in Excel with the use of Pivot tables.
As categorical data may not include numbers, it can be difficult to figure how to visualize this type of data, however, in Excel, this can be easily done with the aid of pivot tables and pivot charts.
There are only a few steps involved in setting up a pivot table
First, click on any cell within the data set. Then press Atl +N+V. This will open the Create Pivot Table dialogue box.
Alternatively, select Pivot table from the Insert Ribbon. This will also open the Pivot Table dialogue Box
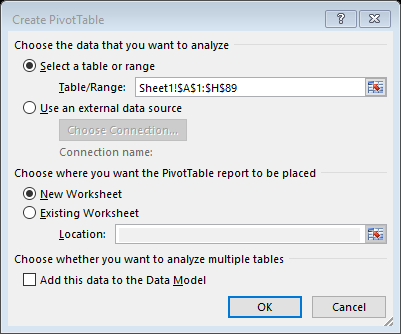
Next, select a table or range of data that is to be included in the pivot table. If the dataset has not been formatted as a table, Excel will make the best guess as to the entire dataset. If Excel gets this wrong you can manually select the range.
Select where you wish the pivot table to be placed, on a new worksheet or the existing worksheet.
In newer versions of Excel, there is also the option to add the data to a Data Model for use in Power Pivot.
Once OK is selected, a blank pivot table will open with the pivot table fields containing the data. The pivot table fields are all the same as the original column headers in your dataset.
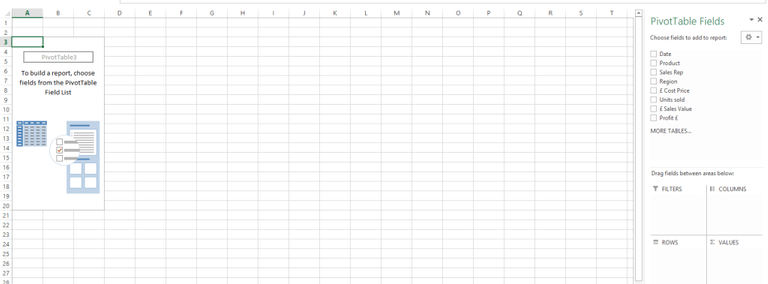
By moving a field to either row or columns in the Pivot table fields you can begin to pivot your data.
From the Value Fields Setting box, in addition to the option 'Summarize Value As', there is also the option to 'Show Value As'. This gives options to select from a list of predefined calculations. These calculations can add a lot of power to your analysis. When you are working with categorical data, using the calculation 'value as %' tends to works best.
This will all make a little more sense when you watch the following video.
Learn and Earn Activity
This weeks learn and Earn activity is more of a Show off your skills and earn. Share your tip below to help Jeff and each tip shared will be tipped with steem.
Sign up for my newsletter – Don’t worry, I won’t spam. Just useful Excel and Power BI tips and tricks to your inbox
The Excel Club blog has now been powered with STEEM. We are a tokenized website where you can earn while you learn. To earn STEEM tokens you must partake in the practice activity and post your answers, questions or feedback in the comments section below.
I would suggest either of these options for getting a STEEM account
- Purchase an instant account for $3.50 with this link
- Sign up with this link for a free account ( you could be waiting up to 2 weeks)
Cross posted from my blog with SteemPress : http://theexcelclub.com/tips-for-analyzing-categorical-data-in-excel/
Hi @paulag and @theexcelclub - I have a tip I can share with Jeff.
COUNTA will allow you to count text items whereas COUNT is used for numbers and dates. So If I was summarizing categorical data I would use COUNTA
Hi @dernan, yes the COUNTA function in excel is great when working with categorical data.