Excel's Map Charts
Map charts can be used to visually display values and category’s across the geographical area. These charts can be worldwide, and they can also be much closers such as your state, county or city. In Office 365 or Excel 2019, you now have the option to use Map visualizations to view your geographical data.
How to insert Excels Map Charts
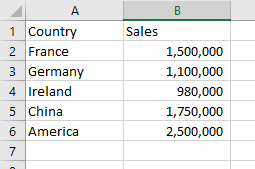
To create a Map Chart in Excel, your data must first be set up correctly. First, you need to have geographical data such as country, state or postcode. You also need some values associated with geographical locations.
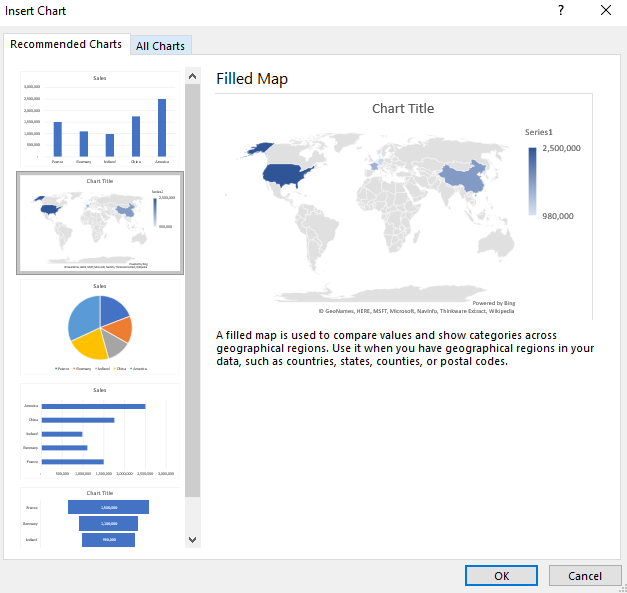
To insert a Map chart in Excel, select the data, or put the active key within the data. From the Insert Ribbon, select Recommended Charts. The Map chart is the 2ndth chart down. Press ok and a map chart will be displayed in your worksheet based on the locations and values provided.
You can also directly insert a map chart using chart commands on the Insert ribbon. To insert a map chart, select the data, or just place the active key within the data. Then, from the insert ribbon select map charts.
As with all charts in Excel, once you insert the chart, a design and format ribbon will become available. These are the same ribbons you would be familiar with from using other charts.
The design ribbon gives you options for adding chart elements and quickly changing the layout and styles of the chart. It is also possible from this ribbon to change the chart type.
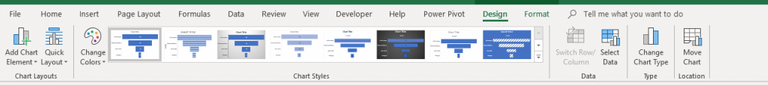
The format ribbon allows you to make changes to the format of the chart, such as changing the text colors and effect.

Trouble Shooting
Excels Maps used Bing to plot the location. To use Excels Map charts you will need a connection to the internet.
Sometimes when you create a map chart using Excel, you will get blanks or errors. It is often the case the location you stated might have more than one location on the map. In this case, you should add another column to your data, so the Maps know where to look.
Sign up for my newsletter – Don’t worry, I won’t spam. Just useful Excel and Power BI tips and tricks to your inbox
Cross posted from my blog with SteemPress : http://theexcelclub.com/excels-map-charts/
fantastic Paula, I have used these maps and I have tried the 3d maps, you should do a tutorial on them too. With maps, I often get errors and need a second column with further geographical data.
hi dernan and thanks for stopping by. Great suggestion on the tutorial thanks.
I look forward to checking this out, adding maps using Bing will be very useful. Thanks for the tip!
you are most welcome, its a nifty little feature :-)