Excel Power Trick - Save Time Without VBA
In the video below you will learn an Excel Power Trick, using Excels Power Query, to transform standard Excel data. This trick promises to save you time month after month.
If you are new to Excels Power Tools (Power Pivot, Power Query and Power View), after you finished this example, you should really take a look at this, I know you will love it!.
But first lets take a look at the problem we are going to solve today. If you scroll down further you can download this data and practice along.
The Problem
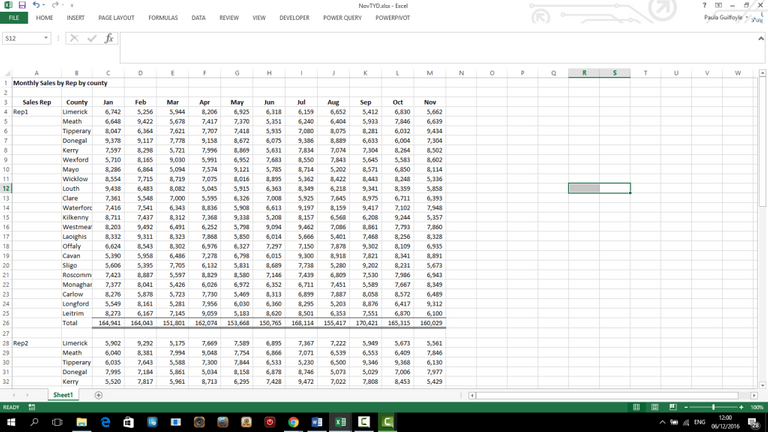
How often have you seen an Excel spreadsheet like the one below? Very often, right? I am sure many of you are even thinking ‘ What’s the problem with that spreadsheet?’
However, I know that some of you can spot the problems straight away!
This matrix style reporting is common in Excel. It contains simple row headers and column headers to identify the elements of the matrix. In this worksheet we have a different for matrix for each sales rep.
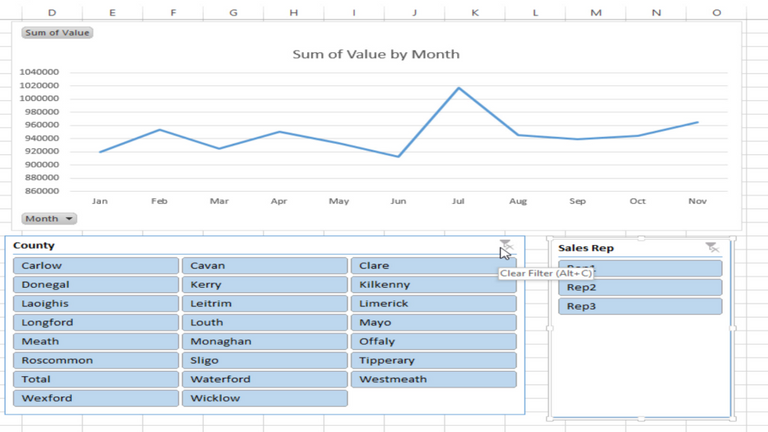
But what if you wanted to analyse your report further or presented in a different way? Using visualizations instead of a table of data such as the image below. How would you go from A (the raw data above) to B (the visualization below) every month as quick as possible?
Long winded solutions
A lot, if not most of the work is transforming the structure of the worksheet. The matrix for each rep needs to be combined, right?
So you could remove the Page title header. Then remove the total rows and also removed blank rows. You would probable fill down the rep and now you would have a combined matrix table of data. Then add some totals. You could create a graph from this combined matrix table of data. But because the formatting is not correct, you would have problems adding slicers.
Assuming we are happy with the graph, the following month we would do the same tasks again when the new file is emailed over. A lot of work right!
Or you could create a table from each rep and then use these tables as a different series within a chart. Again you would have problems with adding slicers because of the data formatting. Then update the tables with new data each month from the new file emailed over?
Which method would you have used?
Do you have a better suggestion?
Why don’t you download the data and have a try? Download data for Excel Power Trick here
For years now people have been creating VBA macros to clean up reports and carry out repetitive tasks. Exactly like the one above. Power Query, known as Get and Transform data in Excel 2016 and later, has the ability to replace VBA macros for many transformation, formatting and data cleansing tasks. You can then save this query and use it over and over as necessary.
Excel Power Trick - Time saving solution
In this Excel Power Trick, you will learn, step by step, how you can create a query to transform data structured in a format that is not efficient for reporting. You will also learn how you can save that query so it can be used again month on month.
Learn and Earn Activity
Earn tokens for answering the questions below: You can use these token against the price of our courses or on other products and services that accept them. Read more about our Learn and Earn activities here.- Could this be the beginning of the end of VBA macros in Excel? Comment below and tell me what you think.
- In the comments below, provide an alternative solution to create the chart & slicers from the raw data and earn rewards
- I have omitted a step in error in this video. this has caused a double count in the final pivot table. Can you spot the error? detail below
10+ Excel Learn and Earn Activities YOU can do Today
SIGN UP FOR OUR NEWSLETTER AND GET EXCEL & POWER BI TIPS TRICKS AND TUTORIAL TO YOUR INBOX
SIGN UP NOW
Take A FREE course with us Today!

- includes XLOOKUP and will soon include Dynamic Arrays


Power Query Excel 365

The Excel Club is the only Excel Blog in the world where you can Earn while you Learn Excel. Find out about our Learn and Earn Activities now

Cross posted from my blog with SteemPress : http://theexcelclub.com/power-trick-save-time-without-vba/
Educational post.I am not good at excel.This article help me lot.
Posted using Partiko Android
Great example of using PQ, Thank you
I love excel and I love to learn....
Greetz from @detlev and a !BEER for you!
View or trade
BEER.Hey @theexcelclub, here is a little bit of
BEERfrom @detlev for you. Enjoy it!you make it look easy
- db2
Thanks, I hope you will give it a try because it is as easy as it looks