Long Term Volatility in the Markets
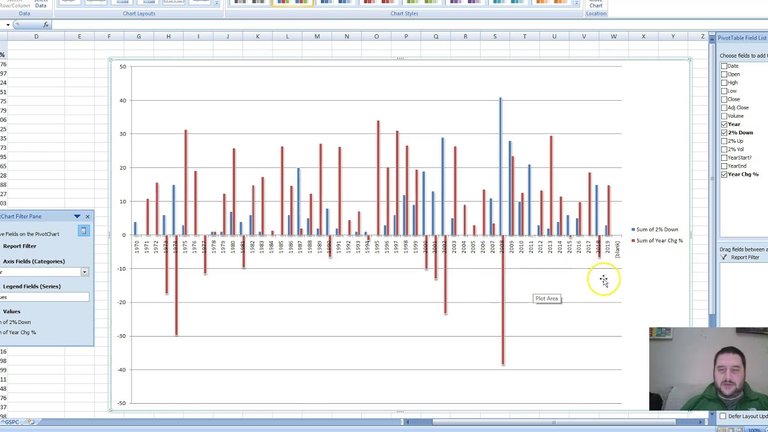
With the market action we've seen recently, I wanted to get a more historical perspective of stock market volatility. So I downloaded the daily price action for the S&P 500 going back to 1970 and pulled out the days that were either 2% up or 2% down and took a look at the annual change in the market price for comparison.
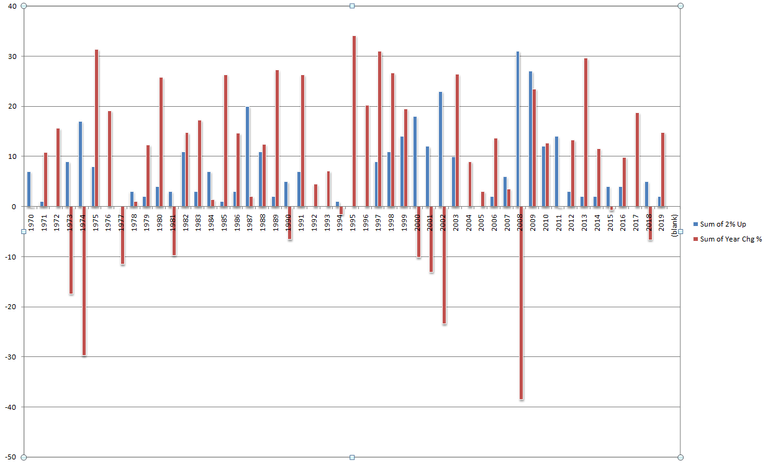
Number of 2% up days with yearly returns:
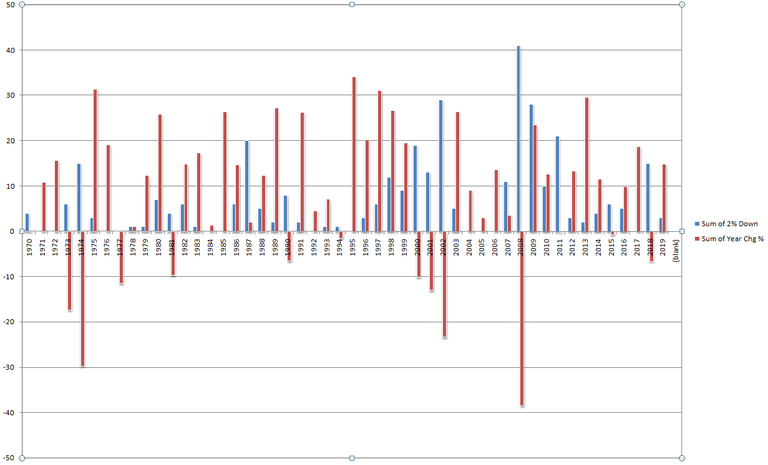
Number of 2% down days and yearly returns:
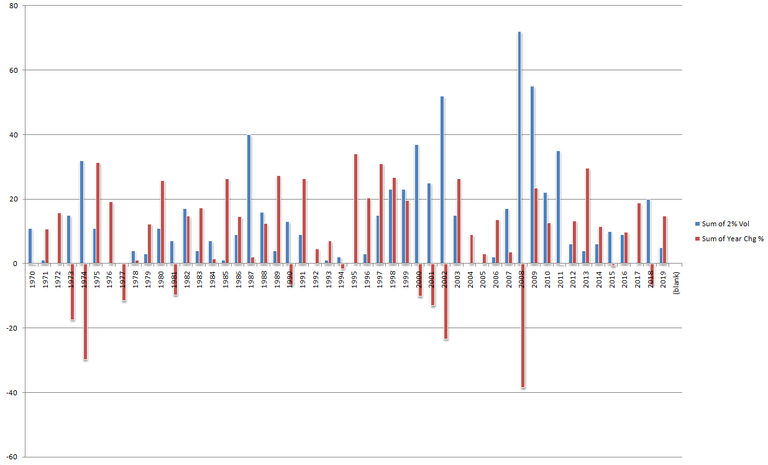
Number of 2% days (either directIon) and yearly returns:
It's nothing conclusive as far as should-i-sell-everything-now, but it does show that 2018 was historically pretty volatile and these things come in waves.
#trading #stocks #fundamentalanalysis
▶️ DTube
▶️ YouTube
0
0
0.000
0 comments